New Global Maps Estimate Forest Carbon Fluxes in Unprecedented Detail

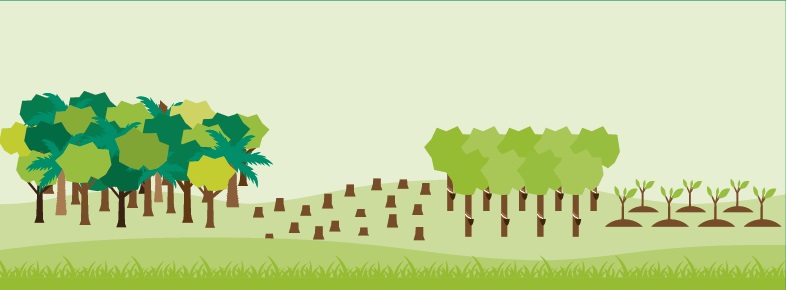
Tree seedlings growing in a nursery in DRC.
-Axel Fassio
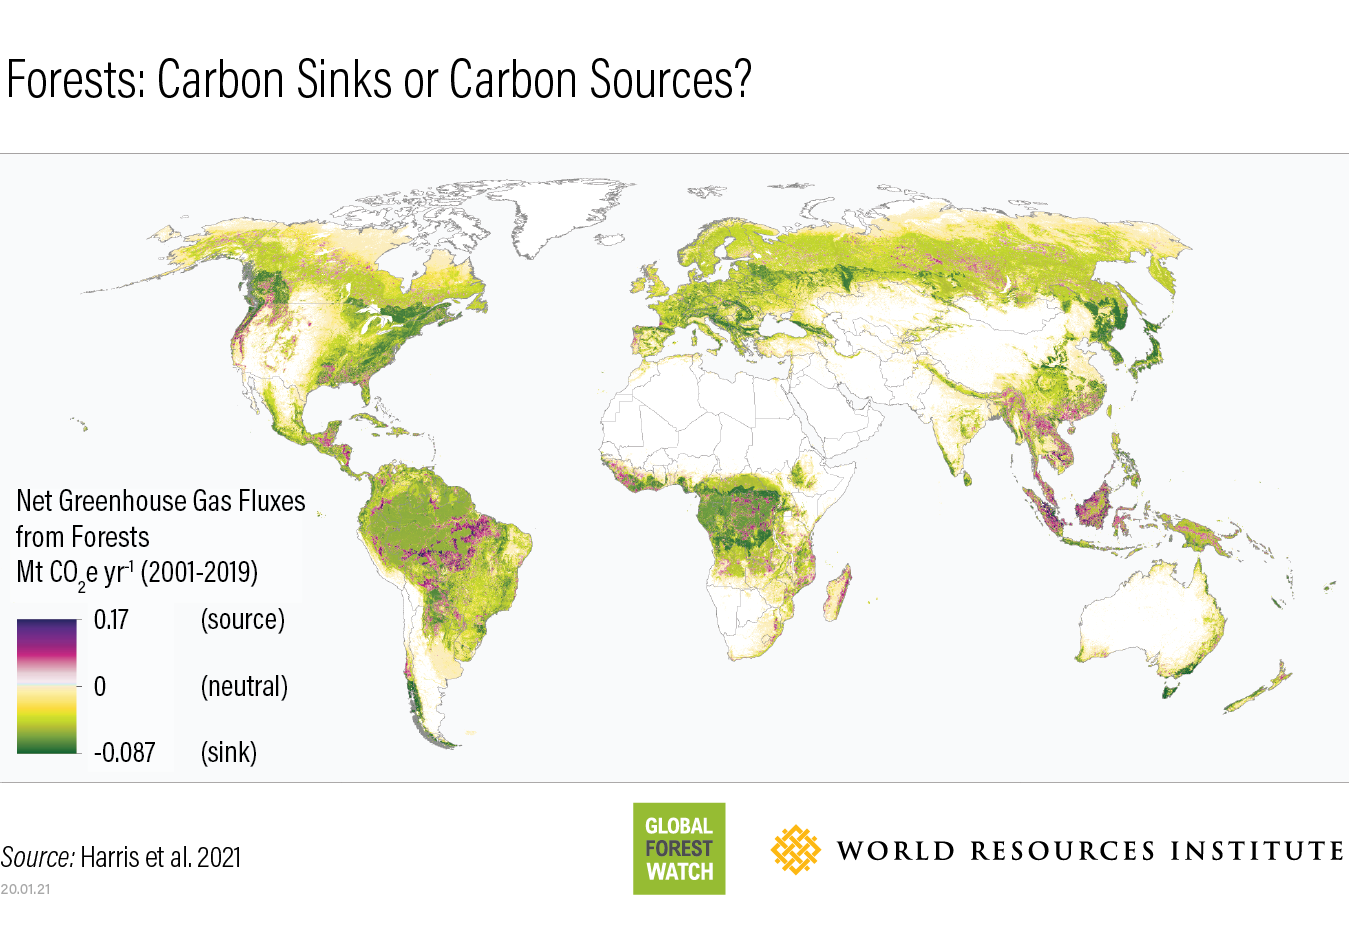
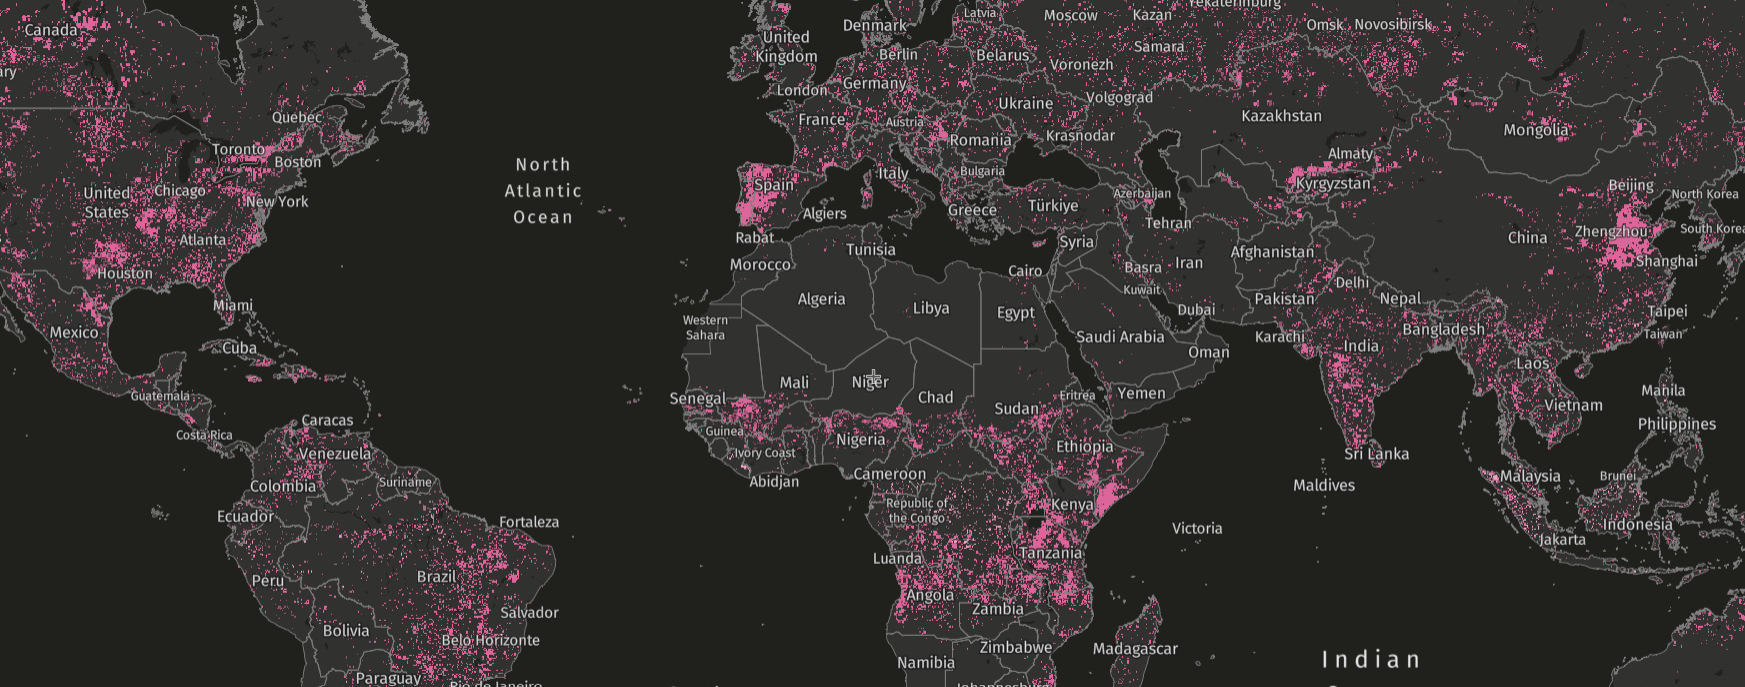
New global maps on GFW provide spatially explicit data on emissions, removals and net carbon fluxes from forests. Whereas previous models only estimate forest carbon fluxes for entire countries or regions, the 30-meter resolution of this data allows users to consistently analyze carbon dynamics in forests down to the local scale. The study was published last week in Nature Climate Change. Here’s what you need to know about the new data.
How were the forest carbon flux maps created?
The new maps on GFW were produced using a groundbreaking new model, which applies the Intergovernmental Panel on Climate Change’s (IPCC) guidelines for national greenhouse gas inventories to high-resolution geospatial data. The inputs to the model include ground, airborne and satellite observations of forest change, disturbances (like deforestation, harvest or burning), and the type, age and condition of forests being lost or gained.
Combining these datasets allows for detailed estimates about how each 30×30 meter piece of forest contributes to global emissions and removals. The maps can be used by researchers to generate national, regional or global-scale estimates of forest carbon fluxes. And thanks to their high resolution, they can also be used by those seeking to monitor local forest carbon dynamics, like Indigenous communities.

How do GFW’s forest carbon numbers compare to other estimates?
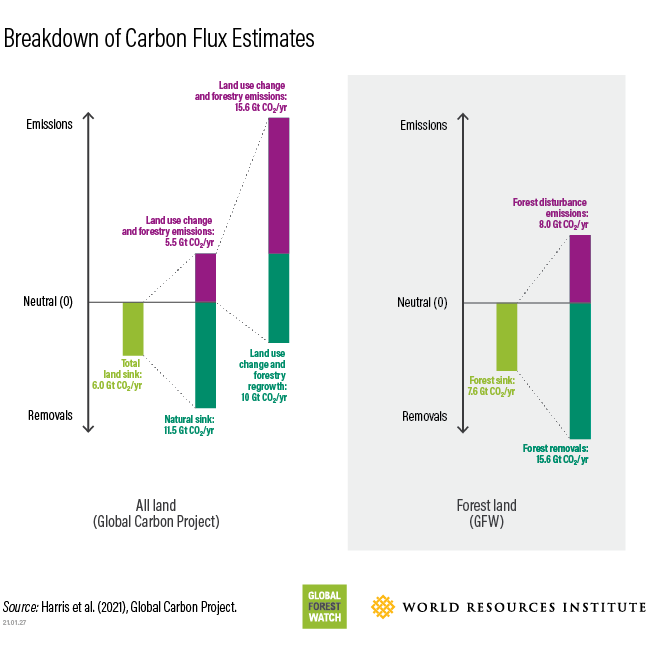
The Global Carbon Project (GCP) is the most frequently cited source of data on land-related emissions, but their estimates do not distinguish among forests, grasslands, croplands or other land types. Given that forests are the largest component of land-based fluxes, this is an important distinction. These new maps isolate carbon moving in and out of forests and improve upon past research in a few significant ways.
1. Consistent methodology maps everything, regardless of human intervention
At the end of the day, the atmosphere doesn’t care whether emissions come from human activity or natural causes. If we want to slow climate change, we must monitor and address all forest carbon fluxes. The new data on GFW simplifies carbon monitoring by mapping all observed emissions and removals using a single model. In contrast, the GCP data only reports emissions related to human activity (which can be hard to define) and estimates different components (e.g., emissions versus removals) using different models. The subjectivity and complexity inherent to this approach tends to obscure the role of land in climate change, making it difficult to advocate for and implement land-based mitigation solutions.

2. Maps are derived from remote sensing data
The new maps on GFW are based on satellite-derived data created using a globally consistent method. As such, the results are comparable at multiple scales, whether you are estimating forest carbon fluxes within a small patch of forest or across an entire region. Both the GCP and some other forest-specific carbon flux estimates combine country-reported forest inventory data and models that simulate vegetation growth, metabolism and death. Different countries use a variety of methods to measure forest carbon, creating inconsistencies when the data is combined. Further, nationally reported data is typically not spatially explicit, which prevents estimation of forest carbon fluxes at sub-national scales.
3. Emissions and removals can be separated
The new maps on GFW allow for separate estimates of emissions and removals, as well as the net flux between them. This is because the model uses the University of Maryland’s Global Forest Change data, which includes separate data on how much tree cover has been lost, gained, or remains standing. Previous global forest carbon studies have only provided data on net fluxes, while a few studies have disaggregated emissions and removals for the tropics only. GFW’s high-resolution maps of emissions and removals can help decision-makers prioritize different types of conservation or restoration interventions across landscapes.
4. The model is designed to be continually improved upon as new data becomes available
For example, new annual tree cover loss data can be folded into the analysis to keep the numbers up to date. As other data, such as drivers of forest loss or more spatially refined carbon removal rates become available, they can be incorporated as well.
How should the new forest carbon model be used?
The new forest carbon maps can be used to complement national forest inventories and satellites directly observing atmospheric carbon dioxide concentrations. The new data’s high resolution, transparent methods, global consistency, and separate accounting of emissions and removals makes it useful for a variety of applications.
- In 2023, the United Nations Framework Convention on Climate Change plans to conduct its first Global Stocktake to assess how the world is doing on its commitments to reduce greenhouse gas emissions. All countries will report their land-related carbon fluxes, which include fluxes from forests. Cross-checking these numbers against transparent and independently derived data like GFW’s will be essential for a robust assessment.
- National governments have set targets for reducing their emissions under the Paris Agreement, and land and forest emissions are a critical piece of that. Spatial data can help governments decide where to prioritize projects working towards these targets.
- Companies setting science-based targets for reducing emissions need to be able to monitor carbon fluxes on the land they own, lease or source products from. National estimates are too coarse and the quality of the data too varied for companies to adequately understand what’s happening in their supply chains from year to year. The higher spatial resolution of the new maps can help companies diligently track carbon on land in and determine where to intervene.
- These new maps can help non-governmental organizations understand the climate impacts of land management decisions, measure what policies and practices are more or less effective at reducing emissions or increasing sequestration, and monitor the extent to which companies and governments are upholding their commitments.
Monitoring is just the first step
This is just the beginning of a new framework for monitoring global carbon fluxes on land. In the future, new research will address some of the key limitations of the current estimates by mapping emissions from forest degradation and improved detection of forest expansion, refining the accuracy and timeliness of the resulting data.
Meanwhile, this method for mapping both emissions and removals from forests offers unprecedented detail for better management now. Reducing emissions from deforestation, while also scaling up carbon dioxide removals available from forests, is necessary for staying below 1.5 degrees of warming.
Explore More Articles

Looking for the Quickest Signal of Deforestation or Vegetation Disturbance Globally? Turn to GFW’s Integrated Disturbance Alerts
GFW’s integrated alerts layer combines the power of four alert systems for an improved view of deforestation and other vegetation disturbances globally.

