How accurate is accurate enough? Examining the GLAD global tree cover change data (Part 1)
Part 2 of this blog series available here.
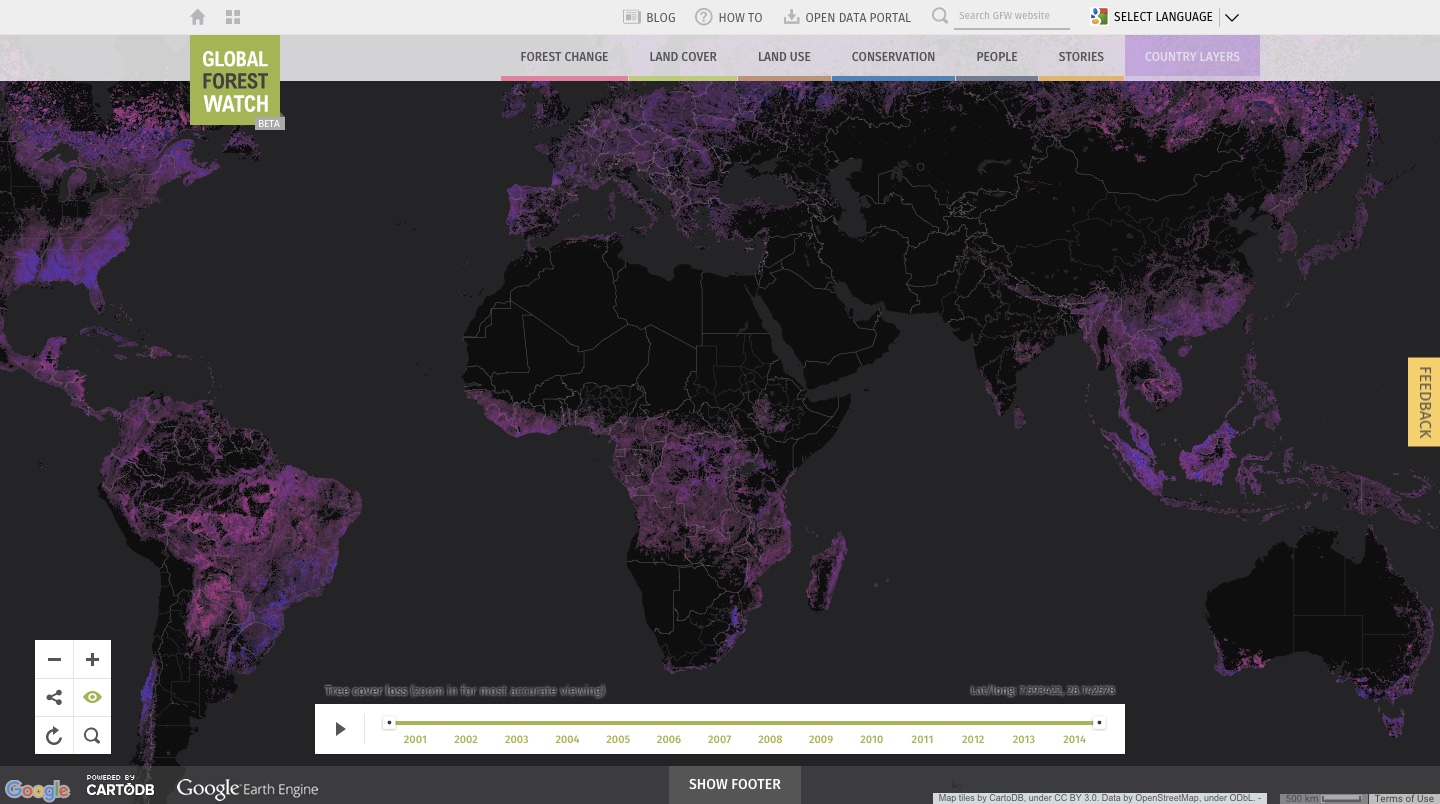
In 2013, Dr. Matt Hansen and collaborators at the University of Maryland’s Global Land Analysis and Discovery group (GLAD), Google, U.S. Geological Survey (USGS) and the National Aeronautics and Space Administration (NASA) released the first global scale method for annually monitoring changes in tree cover using 30-meter resolution Landsat imagery, revolutionizing the way we measure and monitor forests. The GLAD tree cover change data (formerly referred to as the Hansen tree cover change data) set consists of two maps: one of annual tree cover loss from 2001 to 2014, and the other of cumulative tree cover gain during the 2000-2012 time period. Global Forest Watch (GFW) makes this data freely available online for anyone to visualize and analyze through its easy-to-use interactive map. In addition to the analysis-rich platform, the GFW Blog aims to help non-experts understand the data by explaining the underlying methods and results in accessible terms. This blog is the first of a two-part technical series focusing on the accuracy of the GLAD global tree cover change data. In this piece, we explain how the authors measured the accuracy of the data, and in the second installment we explore what this means for users of the data.
How do we measure the accuracy of remotely sensed data?
In remote sensing, the accuracy of data is measured by comparing detected change for sample areas on a map to the true land cover change, also known as “truth data,” which is generally determined using other satellite images or field visits. It is good practice to evaluate the “truth data” independently, or without looking at the map under evaluation because this ensures that researchers aren’t biased in their evaluations. The overall accuracy is the percentage of the sample of pixels where the map and the truth data change match. However, overall accuracy can be overestimated when stable land cover (in this case, forest land with no change) is much more prevalent than the changes (loss and gain)—any mistakes in identifying changes are overwhelmed by how well the computer identifies stable land cover. Examining the false positives (also known as commission errors) and false negatives (also known as omission errors) of the changes can provide a more useful look at the accuracy of the data. A false positive is a 30 meter pixel labelled as “loss” or “gain” on the map, but that did not change in the real world. A false negative is the opposite—a pixel labelled as “no change” by the data that actually lost or gained tree cover.
Just how accurate is the GLAD tree cover change data?
The data’s authors have published two accuracy assessments to date, the first in the original Science article by Hansen et al. (2013) and the second in a recent study by Tyukavina et al. (2015) on carbon loss in forests. In the first study, the authors independently evaluated the true change of 1,500 sample blocks (120 meters on each side) using Landsat, MODIS and Google Earth imagery. The truth data was then compared to the “loss” and “gain” maps globally and within the four major biomes – tropical, subtropical, temperate and boreal. At a global scale, the “loss” map had a 13 percent false positive rate and a 12 percent false negative rate. The “gain” map had a significantly higher rate of error, with a 24 percent false positive rate and a 26 percent false negative rate. The errors of “loss” and “gain” vary substantially between the four major biomes, suggesting that accuracy may be higher or lower depending on the particular location.
| LOSS | GAIN | |||
|---|---|---|---|---|
| Biome | False Positives | False Negatives | False Positives | False Negatives |
| Global | 13.0 percent | 12.2 percent | 23.6 percent | 26.1 percent |
| Tropical | 13.0 percent | 16.9 percent | 18.1 percent | 52.0 percent |
| Subtropical | 20.7 percent | 20.6 percent | 14.5 percent | 17.6 percent |
| Temperate | 11.8 percent | 6.1 percent | 38.0 percent | 23.5 percent |
| Boreal | 12.0 percent | 6.1 percent | 23.3 percent | 1.6 percent |
The authors conducted another test to determine the temporal accuracy of the “loss” data—the extent to which the map detects loss in the correct year. Using the same 1,500 blocks, the authors compared the year of “loss” in the map to the largest change in the validation blocks. They found that the year assigned to the observed tree cover loss was correct 75.2 percent of the time, and was correct within one year before or after 96.7 percent of the time. While the first study tells us about the accuracy at regional and global scales, the second study focused on accuracy of the data in the tropics, and at a higher resolution. The second study looked at the accuracy of 3,000 individual pixels (30 × 30 meters) spread across the tropics of sub-Saharan Africa, South and Southeast Asia and Latin America compared to truth data from Landsat and Google Earth imagery. They found false negative and false positive rates below 20 percent in all areas except for Sub-Saharan Africa, which had 48 percent false negatives. The authors suspect the low accuracy in Africa is related to the prevalence of small-scale disturbance, which is harder to map at 30 meter resolution. They also found that more than 85 percent of false negatives take place within one pixel of mapped “loss,” suggesting that most of the missed loss occurs on the edges of other loss patches.
| LOSS | ||
|---|---|---|
| Continent | False Positives | False Negatives |
| Sub-Saharan Africa | 4 percent | 48 percent |
| South/Southeast Asia | 8 percent | 14 percent |
| Latin America | 4 percent | 17 percent |
What does it all mean?
It’s important to understand how accuracy is measured and be aware of the errors baked into the data. But even if it isn’t 100 percent accurate, can the GLAD tree cover change data still give us valuable insights? Check out Part 2 of this blog series, where we explore what these numbers all mean for users of the GLAD data.