Exploring Tree Cover Gain and Net Change on Global Forest Watch
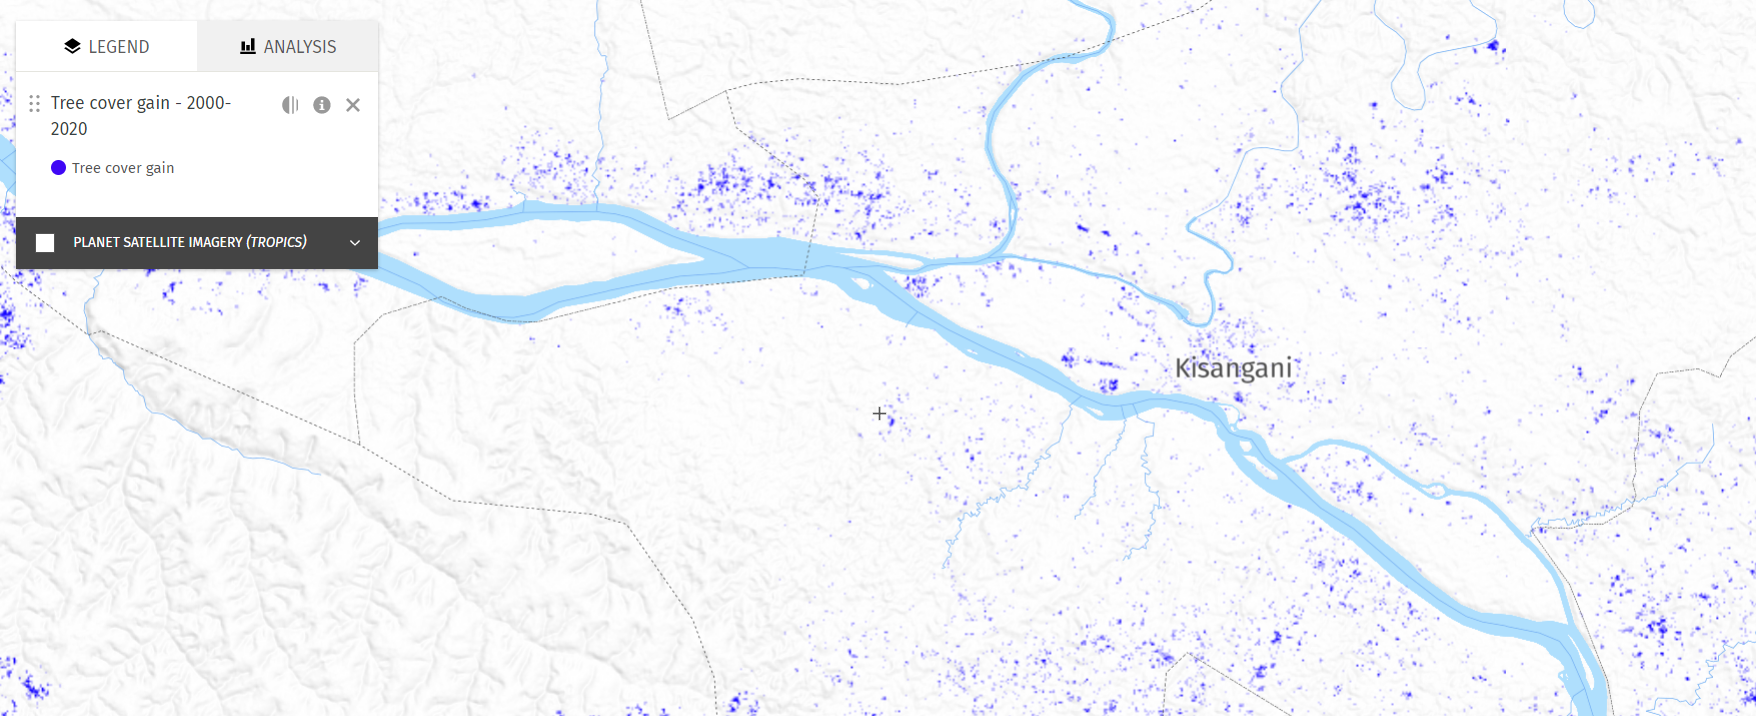
Tree cover gain 2000-2020 visualized on the GFW map
In 2022, researchers at the University of Maryland (UMD) published the first results of global tree cover height and change monitoring between 2000 and 2020, providing an updated look at tree cover height, tree cover gain, and net change in tree cover worldwide. This data set provided much-needed information to complement data on tree cover loss, illustrating all the components of forest change. The data shows that though the world lost more tree cover than it gained from 2000-2020, 36 countries experienced a net gain in tree cover.
Since then, UMD calculated tree height and change in the intervening five-year periods — from 2005, 2010 and 2015. We’ve now made the five-year gain available on Global Forest Watch (GFW) — read on to learn more about how to access it and how it differs from data you may have used in the past.
What’s available on GFW, and how can I access it?
Three different data sets on the GFW platform are based on the height data:
1. Tree cover height in 2000 and 2020: This data shows the height in meters of tree canopy cover in each 30-meter pixel. Users can set the minimum height threshold starting at three meters to view the extent of tree cover above a specific height.
2. Tree cover gain between 2000, 2005, 2010, 2015 and 2020: This data shows areas of tree cover that grew from a height of less than five meters in the base year (either 2000, 2005, 2010 or 2015) to a height of greater than or equal to five meters in 2020. Tree cover gain can include regeneration of natural forests, regrowth after harvesting of planted trees or restoration activities. This layer replaces previous data on tree cover gain between 2000 and 2012.
In addition to viewing the data on the map, users can access statistics on tree cover gain between an adjustable baseline year — either 2000, 2005, 2010 or 2015 — and end year 2020 on the analysis pane and dashboards. In the widget, access the settings to open up the options for adjusting the baseline.
3. Net change in tree cover between 2000 and 2020: This data shows how much more or less tree cover a given location (country, state/province or county/municipality) had in 2020 compared to 2000. This data layer was newly added to GFW in 2022.
In addition to viewing the data on the map, users can access statistics on net change in tree cover between 2000 and 2020 on the analysis pane and dashboards.
Annual data for all three of these data sets will eventually be available. Read more about what we’re learning from these three data sets in the Forest Extent and Forest Gain Indicators in the Global Forest Review.
Why is GFW using tree cover height as well as canopy cover?
The first iteration of the tree cover change data on GFW, including the current annual tree cover loss data and the previous tree cover gain between 2000 and 2012, used definitions based on the percent canopy cover. The three data sets discussed above are all based instead on tree cover height.
The main reason for this switch is because the tree cover height data is more accurate. NASA’s GEDI mission, which uses a lidar sensor aboard the International Space Station, provides point-based measurements of vegetation structure, including forest canopy height, which UMD uses as training data to model tree height globally. The data defining tree cover in 2000 using a minimum height of five meters resulted in an accuracy of 97%, compared to 95% accuracy when tree cover is defined as a minimum canopy cover of 30%.
Additionally, tree cover height allows for improved detection of tree cover gain. Unlike tree canopy cover, which reaches its maximum soon after tree growth begins, tree height changes gradually.
Another value of tree cover height is that it better highlights changes in forest structure related to biomass, carbon storage and wildlife habitat. For example, tree height is linearly related to the increase of forest biomass and carbon storage, and therefore allows us to more accurately monitor carbon sequestration in trees over time.
What’s different about the updated tree cover gain data?
Like the previous tree cover gain data based on canopy cover, the data based on height shows cumulative gain between a base year and an end year. However, the updated data shows tree cover gain in five-year increments between 2000 and 2020, where the previous layer showed gain between 2000 and 2012. With eight additional years of data and a higher temporal cadence, we are now able to see a more recent view of gain and its trajectory since the start of the millennium.
The old data based on canopy cover and updated data based on height also feature slightly different definitions of gain due to the methodological shift from measuring canopy cover to measuring tree cover height, as described above. The old data defined gain as an increase in tree cover to at least 50% canopy cover, while the updated data defines gain as an increase in tree cover to at least five meters tall.
Like the previous data, the updated gain data is available at 30-meter resolution and was produced by the GLAD lab at the University of Maryland based on Landsat satellite images. Future versions of this data will show annual tree cover gain.
What do the new 5-year intervals of tree cover gain data show?
Data from the new intervals provides valuable information on the global trajectory and pace of gain and can help better reveal forest dynamics.
Between 2000 and 2020, a total of 130 million hectares (Mha) of tree cover was gained globally, meaning that 130 Mha of land that had no or very low tree cover in 2000 had trees at least five meters tall in 2020. But what can we say about the trajectory over time?
With the new five-year interval information, we now know that the rate of gain was not consistent over that 20-year time period, ranging from 41.5 Mha gained between 2000-2005 to 22.6 Mha gained between 2015-2020. While the overall trajectory shows a decline in the pace of gain, the decline in the last five-year period for which data are available is less severe. It is also important to consider the lag time between when seedlings are established and when they can be detected by satellite, with a longer time horizon needed for slower growing species. In other words, seedling establishment that occurred at the middle or end of the last five-year period (such as 2017 or later) is likely not captured in the data.
Future annual tree cover height change products will improve our understanding of tree cover gain and allow for more precise and detailed measurements of forest changes over time.
What is net change, and why is it important?
The net tree cover change data tells us how much more or less tree cover there was in 2020 than in 2000 in a particular administrative area such as a country, province or district. This is different from the current annual tree cover loss data or the updated tree cover gain data, both of which focus on gross changes in tree cover. The net change corresponds to the area of gross gain minus the area of gross loss to show the overall change (which can be negative or positive).
Net change is important because loss and gain data by themselves show just one side of the coin. If we consider loss on its own, we‘re not accounting for tree cover that grows back due to restoration efforts, tree plantation establishment or natural regeneration (e.g. after a fire). If we consider gain on its own, we’re focusing only on new forest growth while turning a blind eye to any forests that are cut down next door.
Looking at net change in addition to gross gains and losses gives us a more holistic picture. Net change data is also important for better estimates of carbon fluxes from forests and aligns better with other data such as the FAO’s “forest area net change” statistics in the Forest Resources Assessment.
However, net change alone doesn’t tell us about the quality of tree cover that was lost or gained. For example, primary forests in Southeast Asia that have been replaced by rubber plantations are considered to have no net change if that location had tree cover in both 2000 and 2020. It is important to look at other data sets available on GFW that can help us better understand these dynamics, such as those on primary forests, Intact Forest Landscapes and tree plantations.
How does the annual tree cover loss data fit in?
Future updates to the annual tree cover loss data will also be based on tree cover height data to allow direct comparisons with the updated tree cover height and gain layers going forward. Watch for more information on this change and what it means for tree cover loss resources on GFW and in the Global Forest Review.
Previous years of loss data will also be eventually reprocessed. However, note that until then, the gain and loss data cannot be compared to each other because they are based on different methods and definitions.
What are the plans for updating this data?
GFW is working with UMD to deliver annual data on tree height, including tree cover loss and gain data, which will eventually replace the 20-year data we have now. This will allow us to provide annual updates on global tree cover gain and net change in addition to our annual tree cover loss updates.
In the meantime, you can explore key takeaways about 2000 and 2020 extent, gain and progress toward restoration goals in the Global Forest Review; learn more about what the gain data can and can’t show us about restoration; and explore the data on the GFW map and dashboards.
This piece was originally published in October 2022. It was updated in December 2024 to reflect the latest developments on GFW.