Over Two Decades of Fire-Driven Loss in Exceptional Detail
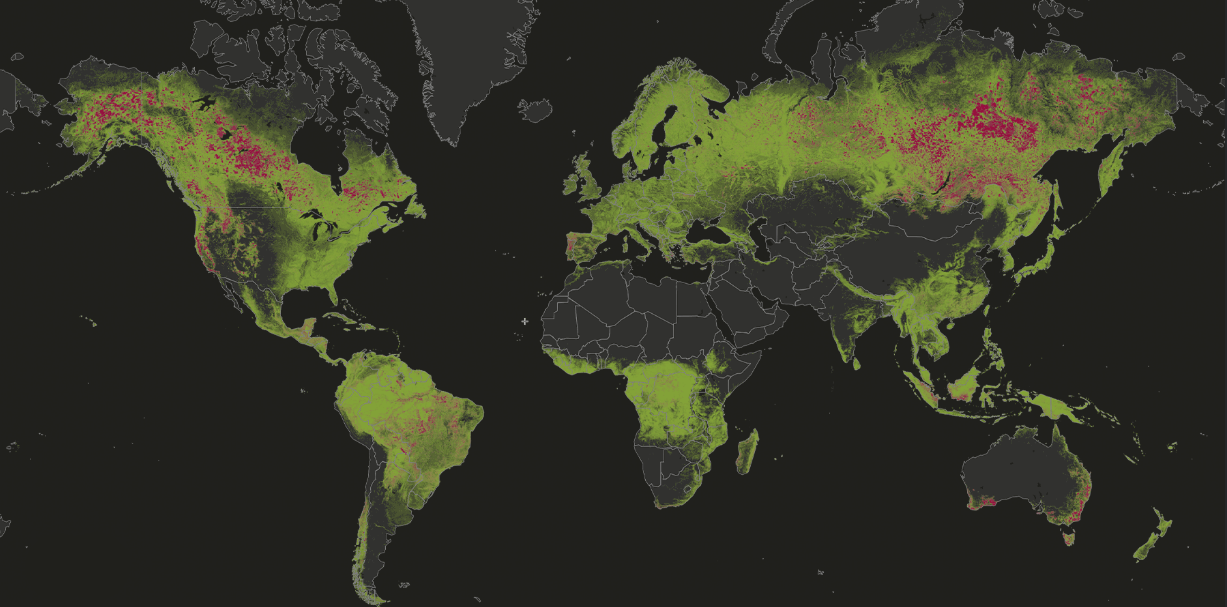
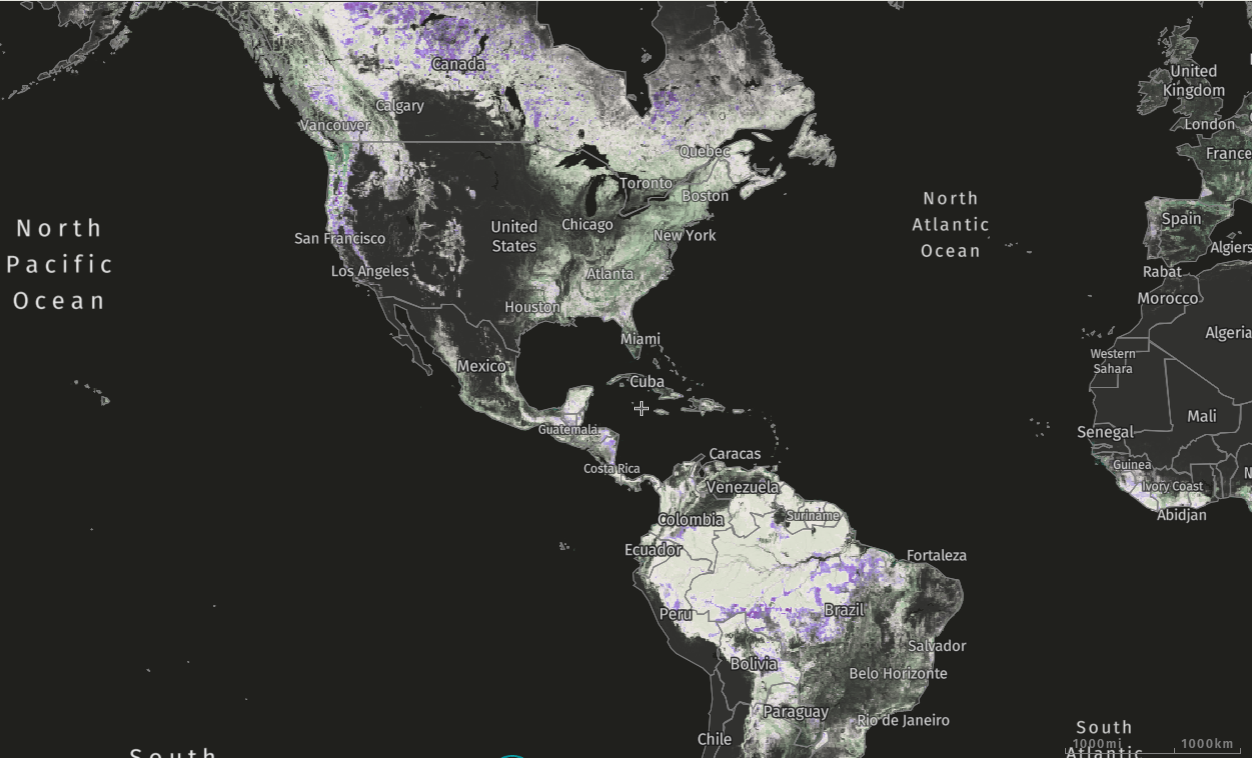
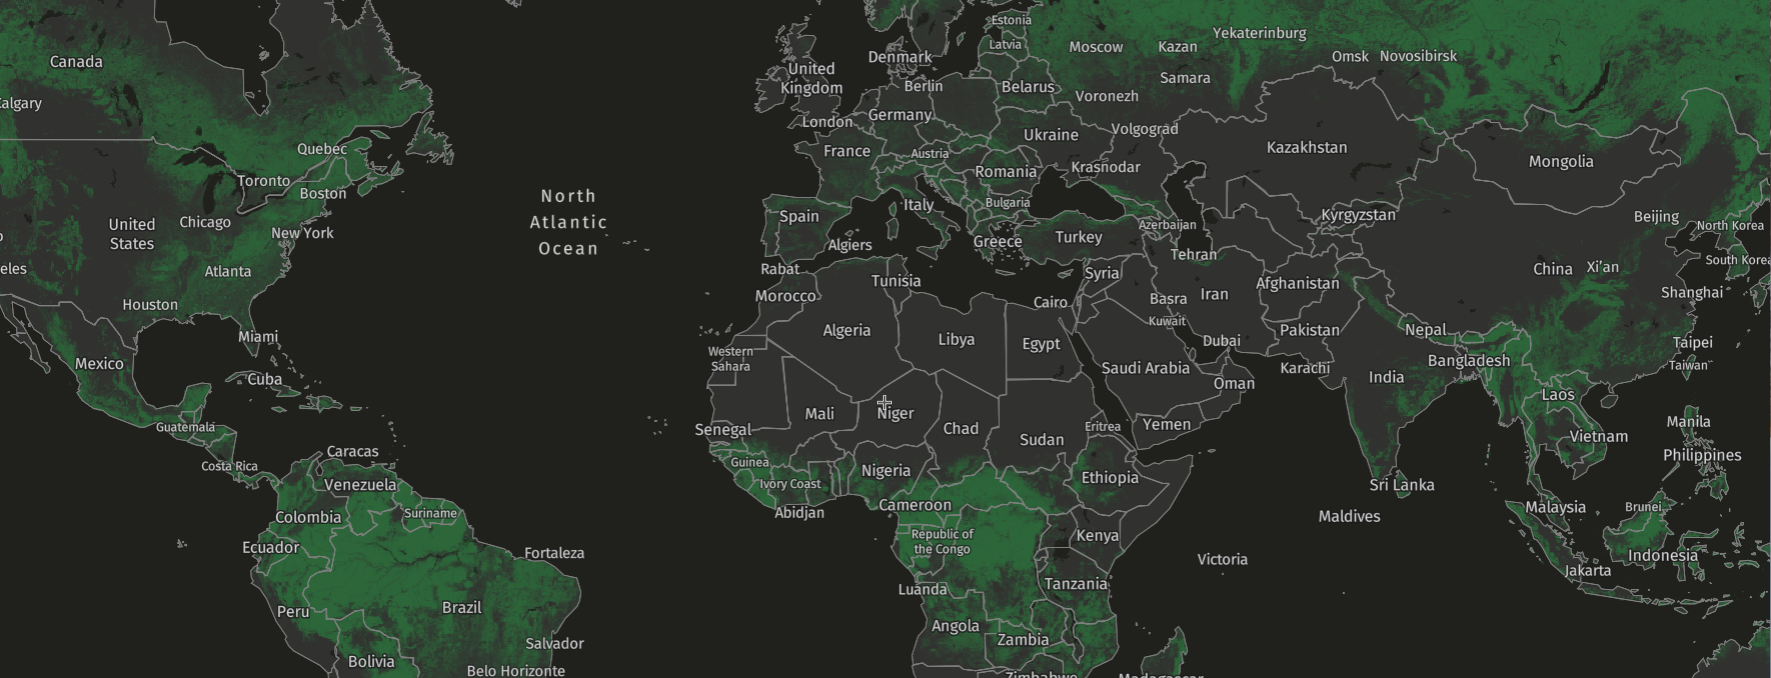
Tree cover loss due to fires visualized on the GFW map, 2001-2021
The latest data from the University of Maryland (UMD), available on Global Forest Watch (GFW), provides a detailed view of how fires have driven tree cover loss across the globe through 2023. The tree cover loss from fires data offers insights on trends in fire-driven loss since 2001 at a higher resolution than other global burned area data sets. Read on to learn what the data measures, how we can use it and how it differs from other fire-related data on GFW.
The Latest Insights Into Trends of Fire-Driven Tree Cover Loss
The tree cover loss from fires data builds on the existing annual tree cover loss data from UMD by providing additional context on where fires are driving loss. Each 30-m pixel in the annual tree cover loss data is analyzed using Landsat satellite images to determine whether the loss was likely due to stand-replacing fires (which kill all or most living trees). This data allows fire-driven loss to be separated from all other drivers of tree cover loss, like agriculture and forestry. Using this data, detailed patterns of tree cover loss due to fires can be assessed over a 23-year period (2001-2023) using a globally consistent definition of fire-driven forest loss.
For this data, loss due to fires is defined as natural or human-ignited fires that result in direct loss of tree canopy cover. This could include wildfires, and intentionally set fires (including escaped fires started by humans for purposes related to agriculture, hunting, recreation or arson). Instances where trees are felled and later burned are not included since the initial driver of loss in that case is mechanical removal. Low-intensity and understory forest fires that do not result in substantial tree canopy loss at the scale of a 30-m pixel are also excluded from this definition.
This data is updated on an annual basis and allows us to better understand global, regional and local trends in tree cover loss as they evolve over time.
How Can We Use the Tree Cover Loss from Fires Data?
Identifying Areas with the Most Tree Cover Loss Due to Fires
Users can use this data to visualize and analyze the spatial distribution of loss due to fires over time on GFW. For example, the global dashboard can help users identify countries with the most tree cover loss due to fires in the previous year.
Looking at the list, Canada, Russia, and Brazil had the most tree cover loss due to fires in 2023. After analyzing the downloaded data, we can see that these three countries combined lost nearly 10.6 million hectares or 89% of all fire-related loss in 2023.
We can then view how fire activity has changed over time for these areas. For example, in 2023, Canada experienced the largest area of tree cover loss the country has seen in 23 years, 91% of which was due to fires.
Users can also use the GFW map to visualize when and where these fires occurred and select specific years to dig deeper into the data. For instance, looking at the map, it is clear that most of Canada’s fires in 2023 occurred across the western provinces and Quebec.
Separating Trends in Fire-Related Tree Cover Loss from Other Drivers
In some cases, this data set can also provide insights into trends of forest loss that are not due to fires. Since loss from fires tends to vary significantly year to year depending on climate and other conditions, it can obscure the longer-term trend in tree cover loss from other drivers.
For example, the annual tree cover loss data on primary forest loss in Brazil shows a large spike in 2016 and 2017 that is not captured by the official deforestation monitoring system for the Brazilian Amazon, PRODES. Using the tree cover loss due to fires data, we can see that much of that spike was due to loss from fires, which are typically not captured by the PRODES system. Understanding where fire drives forest loss and where it does not helps provide more nuance when interpreting the data and allows more direct comparisons with other data sources.
What are the Limitations for Using this Data?
In a previous blog, we describe changes to the tree cover loss data since 2001 and recommend caution for comparing trends before and after 2015. This data on fires builds on that tree cover loss data set, so the same cautions apply. While the changes to the tree cover loss data have resulted in improved detection of forest loss in recent years, including better detection of fires in the boreal forests and other regions, it has also introduced inconsistencies over time.
Despite these inconsistencies, the data features high levels of spatial and temporal accuracy at the global level (assessed for 2001-2019). Globally, 90% of areas classified as tree cover loss due to fires were classified correctly; the other 10% were false positives.
Spatial accuracy varied by region but remained relatively high for most regions. Europe and North America had the highest levels of accuracy with false positive rates of 7% and 4%, respectively. Africa had the lowest accuracy and the highest number of false positives, with 39% of the area labeled as tree cover loss due to fires incorrectly classified. The high false positive rate in Africa is likely because forest fires there are relatively rare.
| Region | False Positive Rate |
|---|---|
| North America | 4% |
| Europe | 7% |
| Latin America | 26% |
| Southeast Asia | 27% |
| Africa | 39% |
| Global | 10% |
There are also cases where there are delays in detecting tree cover loss due to fires, where the loss occurs close to the end of the year but there aren’t enough clear satellite images to detect it until the following year. This is important to note because sometimes spikes we see in loss due to fires can reflect trends from the previous year. Overall, 96% of all fire-related loss events between 2001 and 2019 occurred within one year of the mapped loss date.
What Other Fire Data is on GFW, and What’s Different About the Tree Cover Loss from Fire Data?
The fire data available on GFW falls into two categories: fire activity data and contextual data. Fire activity data allows users to view ongoing fires and analyze the extent of fires in areas of interest, such as a country or user-defined polygon. Contextual data can be used to supplement the fire activity data and help users understand what areas are at risk of fire and the impacts of fire on air quality.
Comparison of GFW Fire Data
Fire Activity
| Data Set | Resolution | Data Source | Update Frequency | Date Range | Best Use |
Tree Cover Loss from Fires | 30m | UMD/GLAD | Annual | 2001-2023 | Calculating extent of stand-replacing forest fires | |
VIIRS Fire Alerts | 375m | NASA | Twice daily | 2012-Present | Detecting fire locations in near-real-time (day/night) | |
MODIS Fire Alerts* | 500m | NASA | Twice daily | 2000-Present | Detecting fire locations in near-real-time (day) | |
Contextual | Global Fire Weather Index | 10km | NASA GFWED | Daily | Present | Current fire risk |
Global Air Quality Index | n/a | World Air Quality Index US EPA | Every 15 minutes | Present | Fire-related effects on air pollution
|
Fire Activity Data
Tree Cover Loss from Fires Data
The tree cover loss from fires data differs from other fire activity data on the GFW platform because it focuses solely on stand-replacing forest fires, while other fire data sets do not make a distinction between stand-replacing fires and other fires. This is important because forests act as carbon sinks and contain most of the land-based carbon on the planet, which is released when they burn.
The tree cover loss from fire data also tracks fires at a much finer resolution than the other fire activity data such as MODIS burned areas; however, it is also updated less frequently, making it less useful for monitoring ongoing or very recent fire activity.
Other Fire Activity Data
Near-real-time alerts (MODIS and VIIRS): MODIS* and VIIRS active fire alerts provide users with near-real-time data that is updated daily and can be used to monitor and respond to ongoing fires. The alerts can detect varying fire sizes depending on the fire temperature, time of day and presence of cloud cover or heavy haze.
Users can analyze fire activity data on the GFW map and dashboard, and filter the data to only view fires that occur in primary forests or other areas of conservation importance. Signing up for a myGFW account also gives users the option to create and analyze custom areas of interest. Users can also stay up to date on fire activity in their custom areas by subscribing to notifications through their myGFW account.
Contextual Data
- Fire risk (Global Fire Weather Index): The Global Fire Weather Index can be used to identify areas where climate conditions make landscapes more vulnerable to fires, allowing users to understand the current risk of burning.
- Health impacts (Global Air Quality Index): The Global Air Quality Index measures current air quality of particulate matter which is strongly impacted by smoke and haze from fires. With over 15,000 stations worldwide, this helps users measure the risk of health effects related to air pollution.
The tree cover loss from fires data is a valuable data set in the suite of fire-related data on GFW and enables all users to better track the impact of fires on forests worldwide to develop more effective management responses.
View a webinar in English, Spanish, Portuguese and Bahasa Indonesia to learn more about tree cover loss from fires and other fire-related data on Global Forest Watch.
This piece was originally published in 2022. It was updated in August 2024 to reflect the latest developments with the tree cover loss due to fires data.