3 Ways Governments Can Prevent Fake Data on Forests
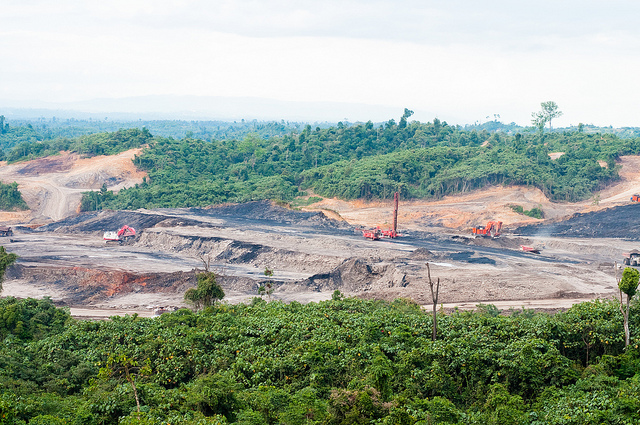 Landscape in East Kalimantan, Indonesia. Photo by Moses Ceaser/CIFOR
For years, non-government organizations in Indonesia have been pressuring the government to release data on its forests, such as the location of agricultural plantations and protected areas. Access to government-owned forest data is critical in the country because deforestation runs rampant, in part due to unreliable or inaccessible data that makes forest monitoring and law enforcement difficult. Yet, the Indonesian government has been reluctant to release digital spatial data, citing concerns it could be altered and misused. But the reality is that there are a number of ways to stop the spread of fake data.
A Need for Better Data Transparency
As a member of the Open Government Partnership, the Indonesian government has committed to increasing transparency and accountability, and has published some forest data, such as the boundaries of pulp and paper and palm oil plantations. However, a recent WRI study shows that the data it has released is in an outdated format, preventing anyone from doing further computer analysis of it. This makes it impossible to do things like calculate the number of peat fires that occur inside and outside concessions, or detect forest clearing inside protected areas. The government has also challenged several recent court orders to release other map-based spatial data. By only publishing non-machine-readable data and not publishing other data sets at all, the Indonesian government avoids the risk of their data being misrepresented, but creates a lack of transparency that contributes to poor land management.
3 Ways to Prevent Fake Data
Instead, the government should employ tactics that can ensure the fidelity of the spatial data they publish, such as:
- Data-sharing agreements can hold users accountable to rigorous terms and conditions. The agreement should contain information such as who the data owner is, how users are allowed to use the data, and the terms and conditions to regulate data distribution. While the agreement is not a tracking tool for alterations, it can serve as contract for how the data should or should not be used and distributed.
- Timestamps stored in the metadata of a shapefile, a common format for spatial data, can track when alterations to a dataset are made. Metadata, or information describing the data, contain details about the data owner, how the data was created, and most importantly, the timestamp of when the data was last updated.
- Digital watermarks, or signatures, can help users identify original spatial data from its altered copies. A study by the University of Portsmouth has shown that this technique can be applied in spatial data. Shapefiles can be watermarked in several ways, including inserting an identification code into the coordinates in the dataset or encrypting the spatial dataset.
Data Transparency Helps Natural Resources and the Government
Making spatial data publicly available can also be a boon to the government. Greater data transparency can help other organizations supplement the government’s forest monitoring efforts by using their own resources to track illegal or unsustainable activities.
We’re already seeing these benefits play out in other countries. In Brazil, for instance, a study suggested that a satellite-based system of deforestation hot spots enhanced law enforcement’s monitoring capacity, preventing deforestation of more than 59,500 square kilometers (5,950,000 hectares) in the Amazon between 2007 and 2011. This publicly available system has also empowered citizens and civil society groups to track deforestation and advocate for the government to issue harsh penalties for illegal logging. The evidence shows that publicly accessible spatial data, when done right, can have a positive impact. Indonesia and other forested nations can reap the benefits by making data transparency a reality.