Getting at the Source: Universal Mill List Improves Traceability of Palm Oil Supply Chains
DCIM100MEDIADJI_0342.JPG
Despite the increasing number of corporate commitments to zero-deforestation, tracing products back to their sources still proves an obstacle to determining whether or not companies have met their sustainability goals.
Palm oil supply chains are large and complex and achieving traceability to farm level can be a time and resource-intensive undertaking. A major consumer goods manufacturer might buy from a dozen or more direct suppliers, each of which source from hundreds of palm oil mills across several countries. Each mill, in turn, may source from multiple plantations and smallholder farms in the surrounding area. The abundance of potential sources makes it difficult to get a clear picture of which products are definitively contributing to deforestation.
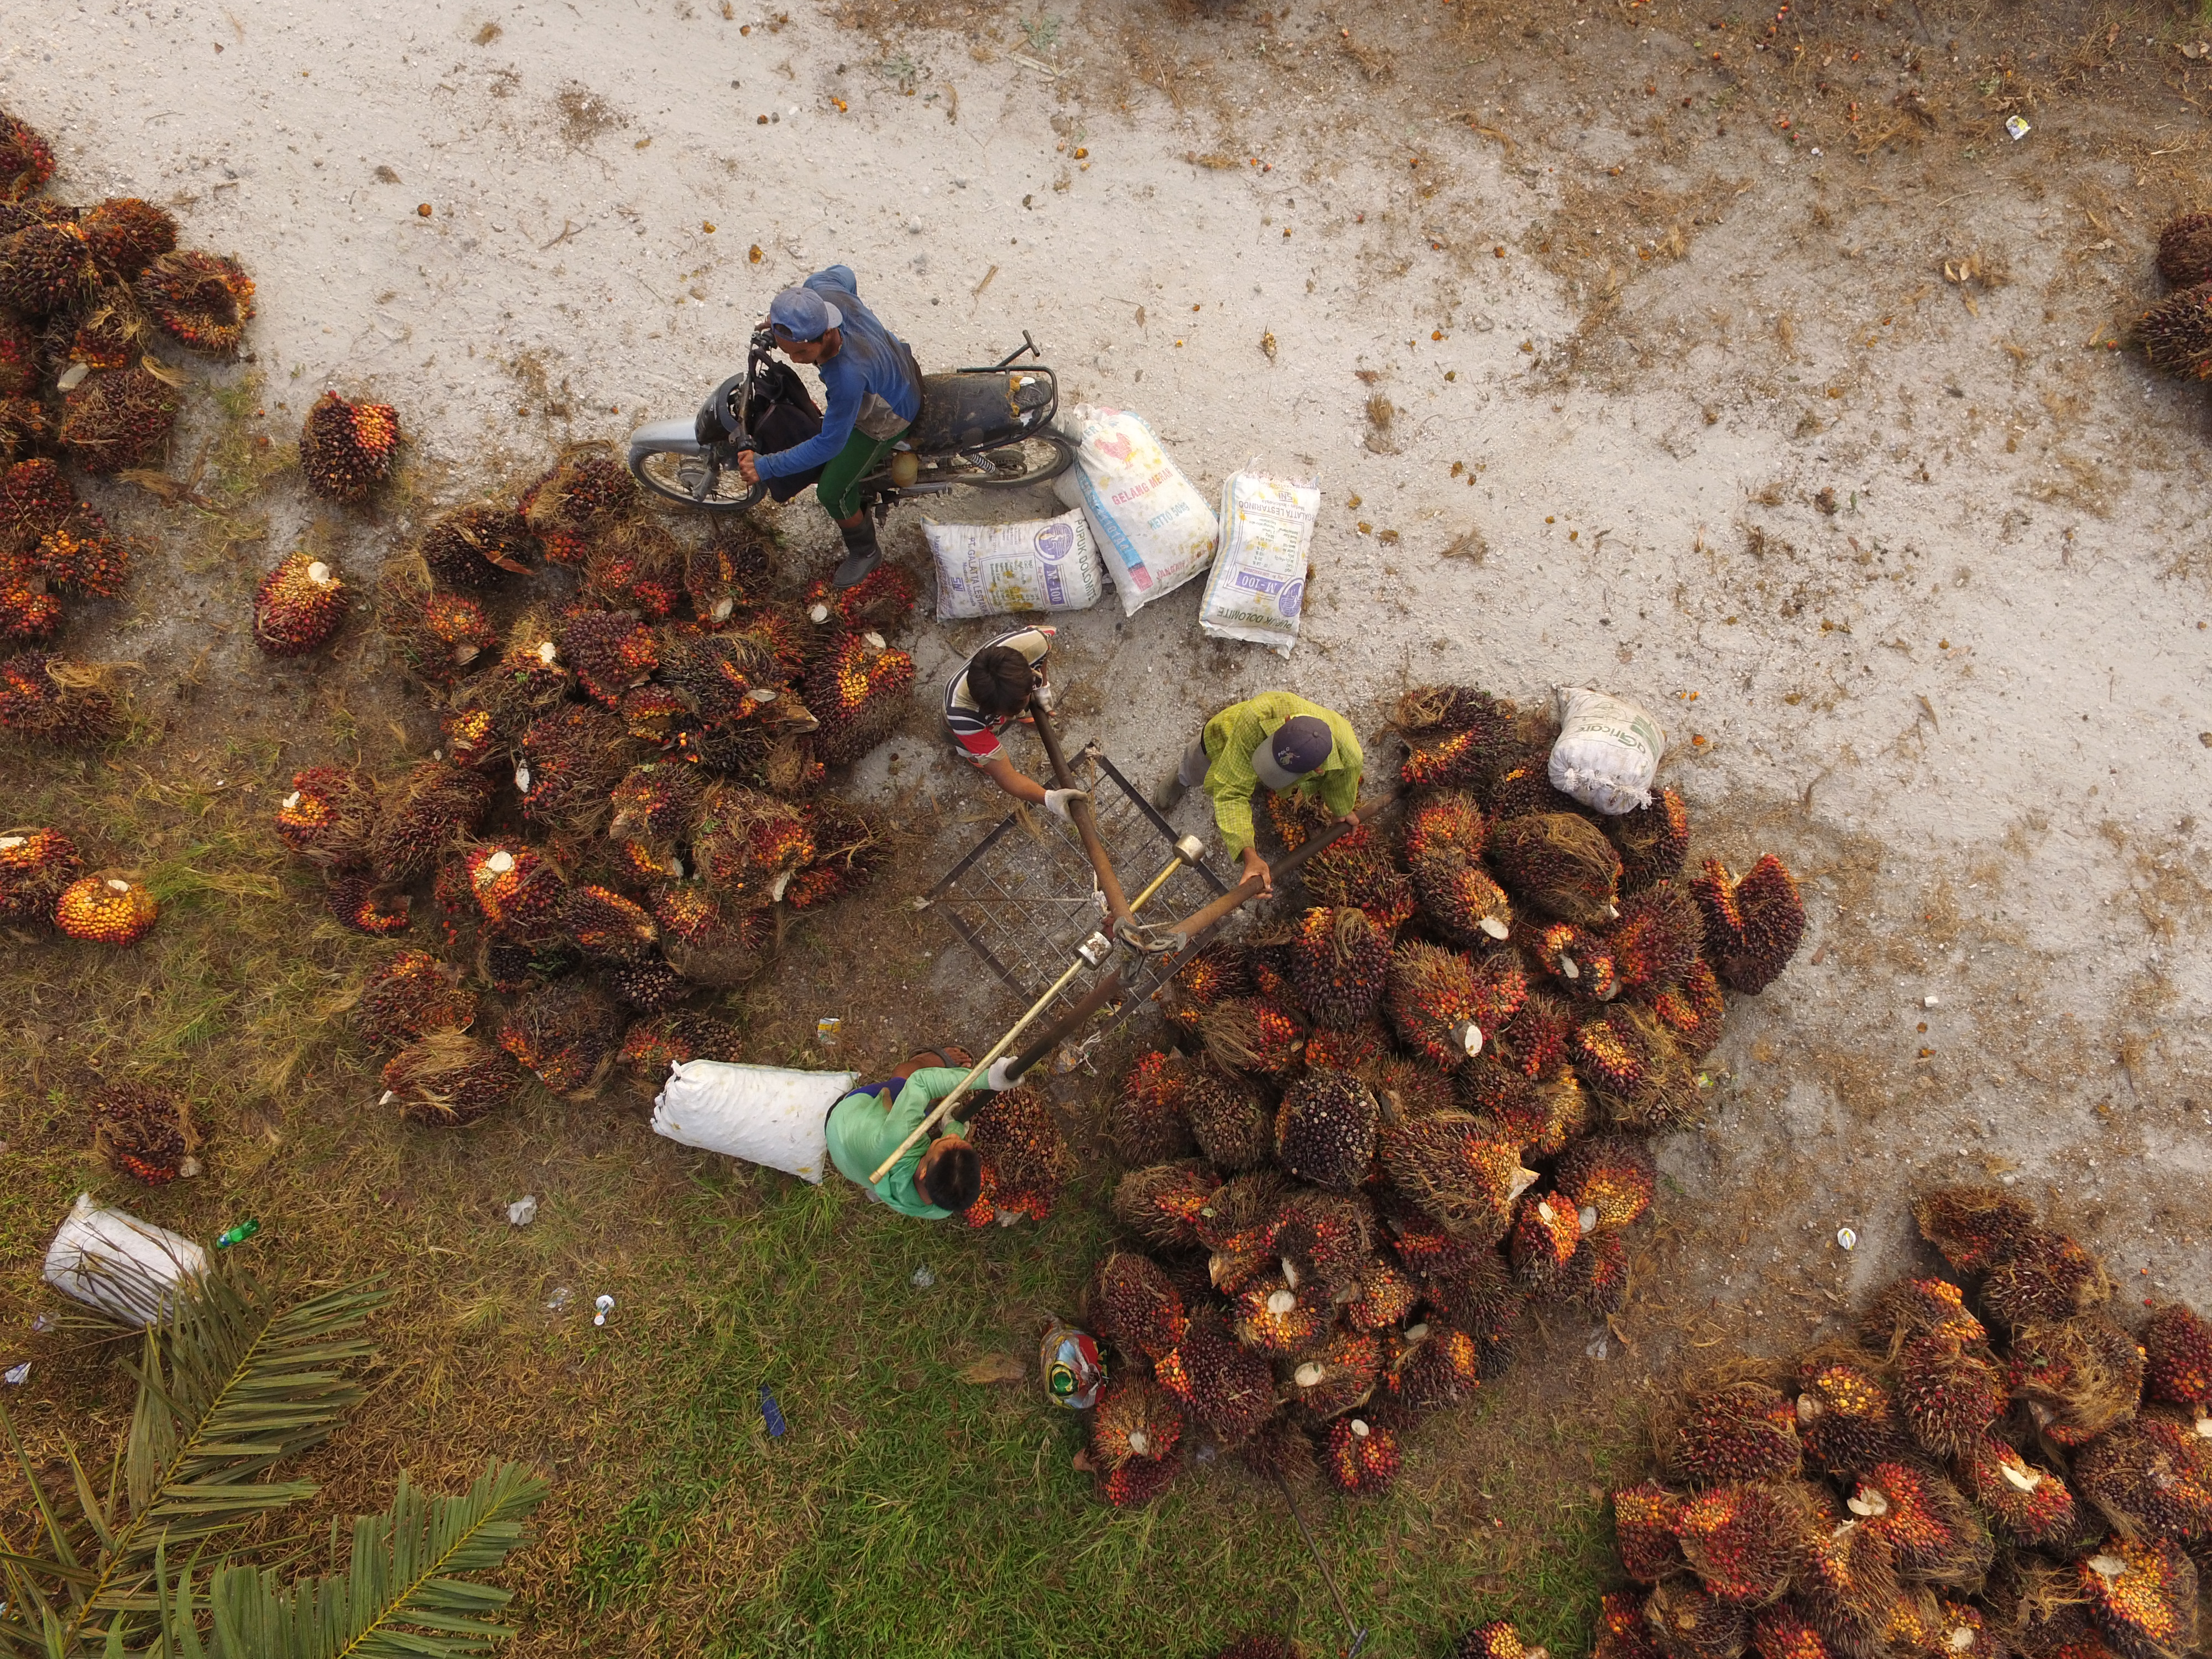 Harvested oil palm fruit at a plantation in Indonesia. Ridhwan Siregar/WRI Indonesia.
A critical step towards palm oil supply chain traceability is identifying the locations of mills. The new Universal Mill List (UML), created by the World Resources Institute (WRI), Rainforest Alliance (RA), Proforest and Daemeter identifies and maps 1,815 mills across 26 countries in order to provide a better framework for companies looking to monitor and report on their commitments.
The UML integrates company data contributed from processors, traders and consumer goods manufacturers, the Roundtable on Sustainable Palm Oil (RSPO) and FoodReg. Large companies like Unilever and Mondelēz International also played an active role in contributing to the list.
Though not as precise as a farm boundary, the location of a mill provides a useful estimate of where the palm oil supply is coming from, based on an indicative supply base around its location. This, in turn, can provide the basis for preliminary risk assessment, field-level verification and supplier engagement.
Until now, there has not been a standardized approach to the verification and harmonization of mill data, nor has there been a global, industry-accepted dataset of mills in the public domain. Traceability to the mill level is not a simple task. Many companies have invested a great deal of time and resources into collecting and verifying supplier mill information — including location, name and parent company of the mills. Some have taken the additional step to publish their supplier lists publicly.
Despite the significant progress towards transparency made by companies with their individual mill lists, much of the available data remains imperfect and inconsistent between sources. In many cases, the location or identifying characteristics of mills are inaccurate and the associated information for a given mill differs from one source to another. This poses a number of challenges for accurate reporting and efficient follow up efforts.
The UML however, can reduce these discrepancies by using a standard process to assemble disparate information into one convenient source of mill data. The location of each mill in the UML has been verified using high resolution Planet imagery, and verified locations are assigned “universal IDs”. These IDs will ensure there is no duplication across company datasets, as each mill has a unique assigned number. Use of this standardized methodology and ID system moving forward will facilitate future updates to the list as well as alignment efforts with additional data contributions.
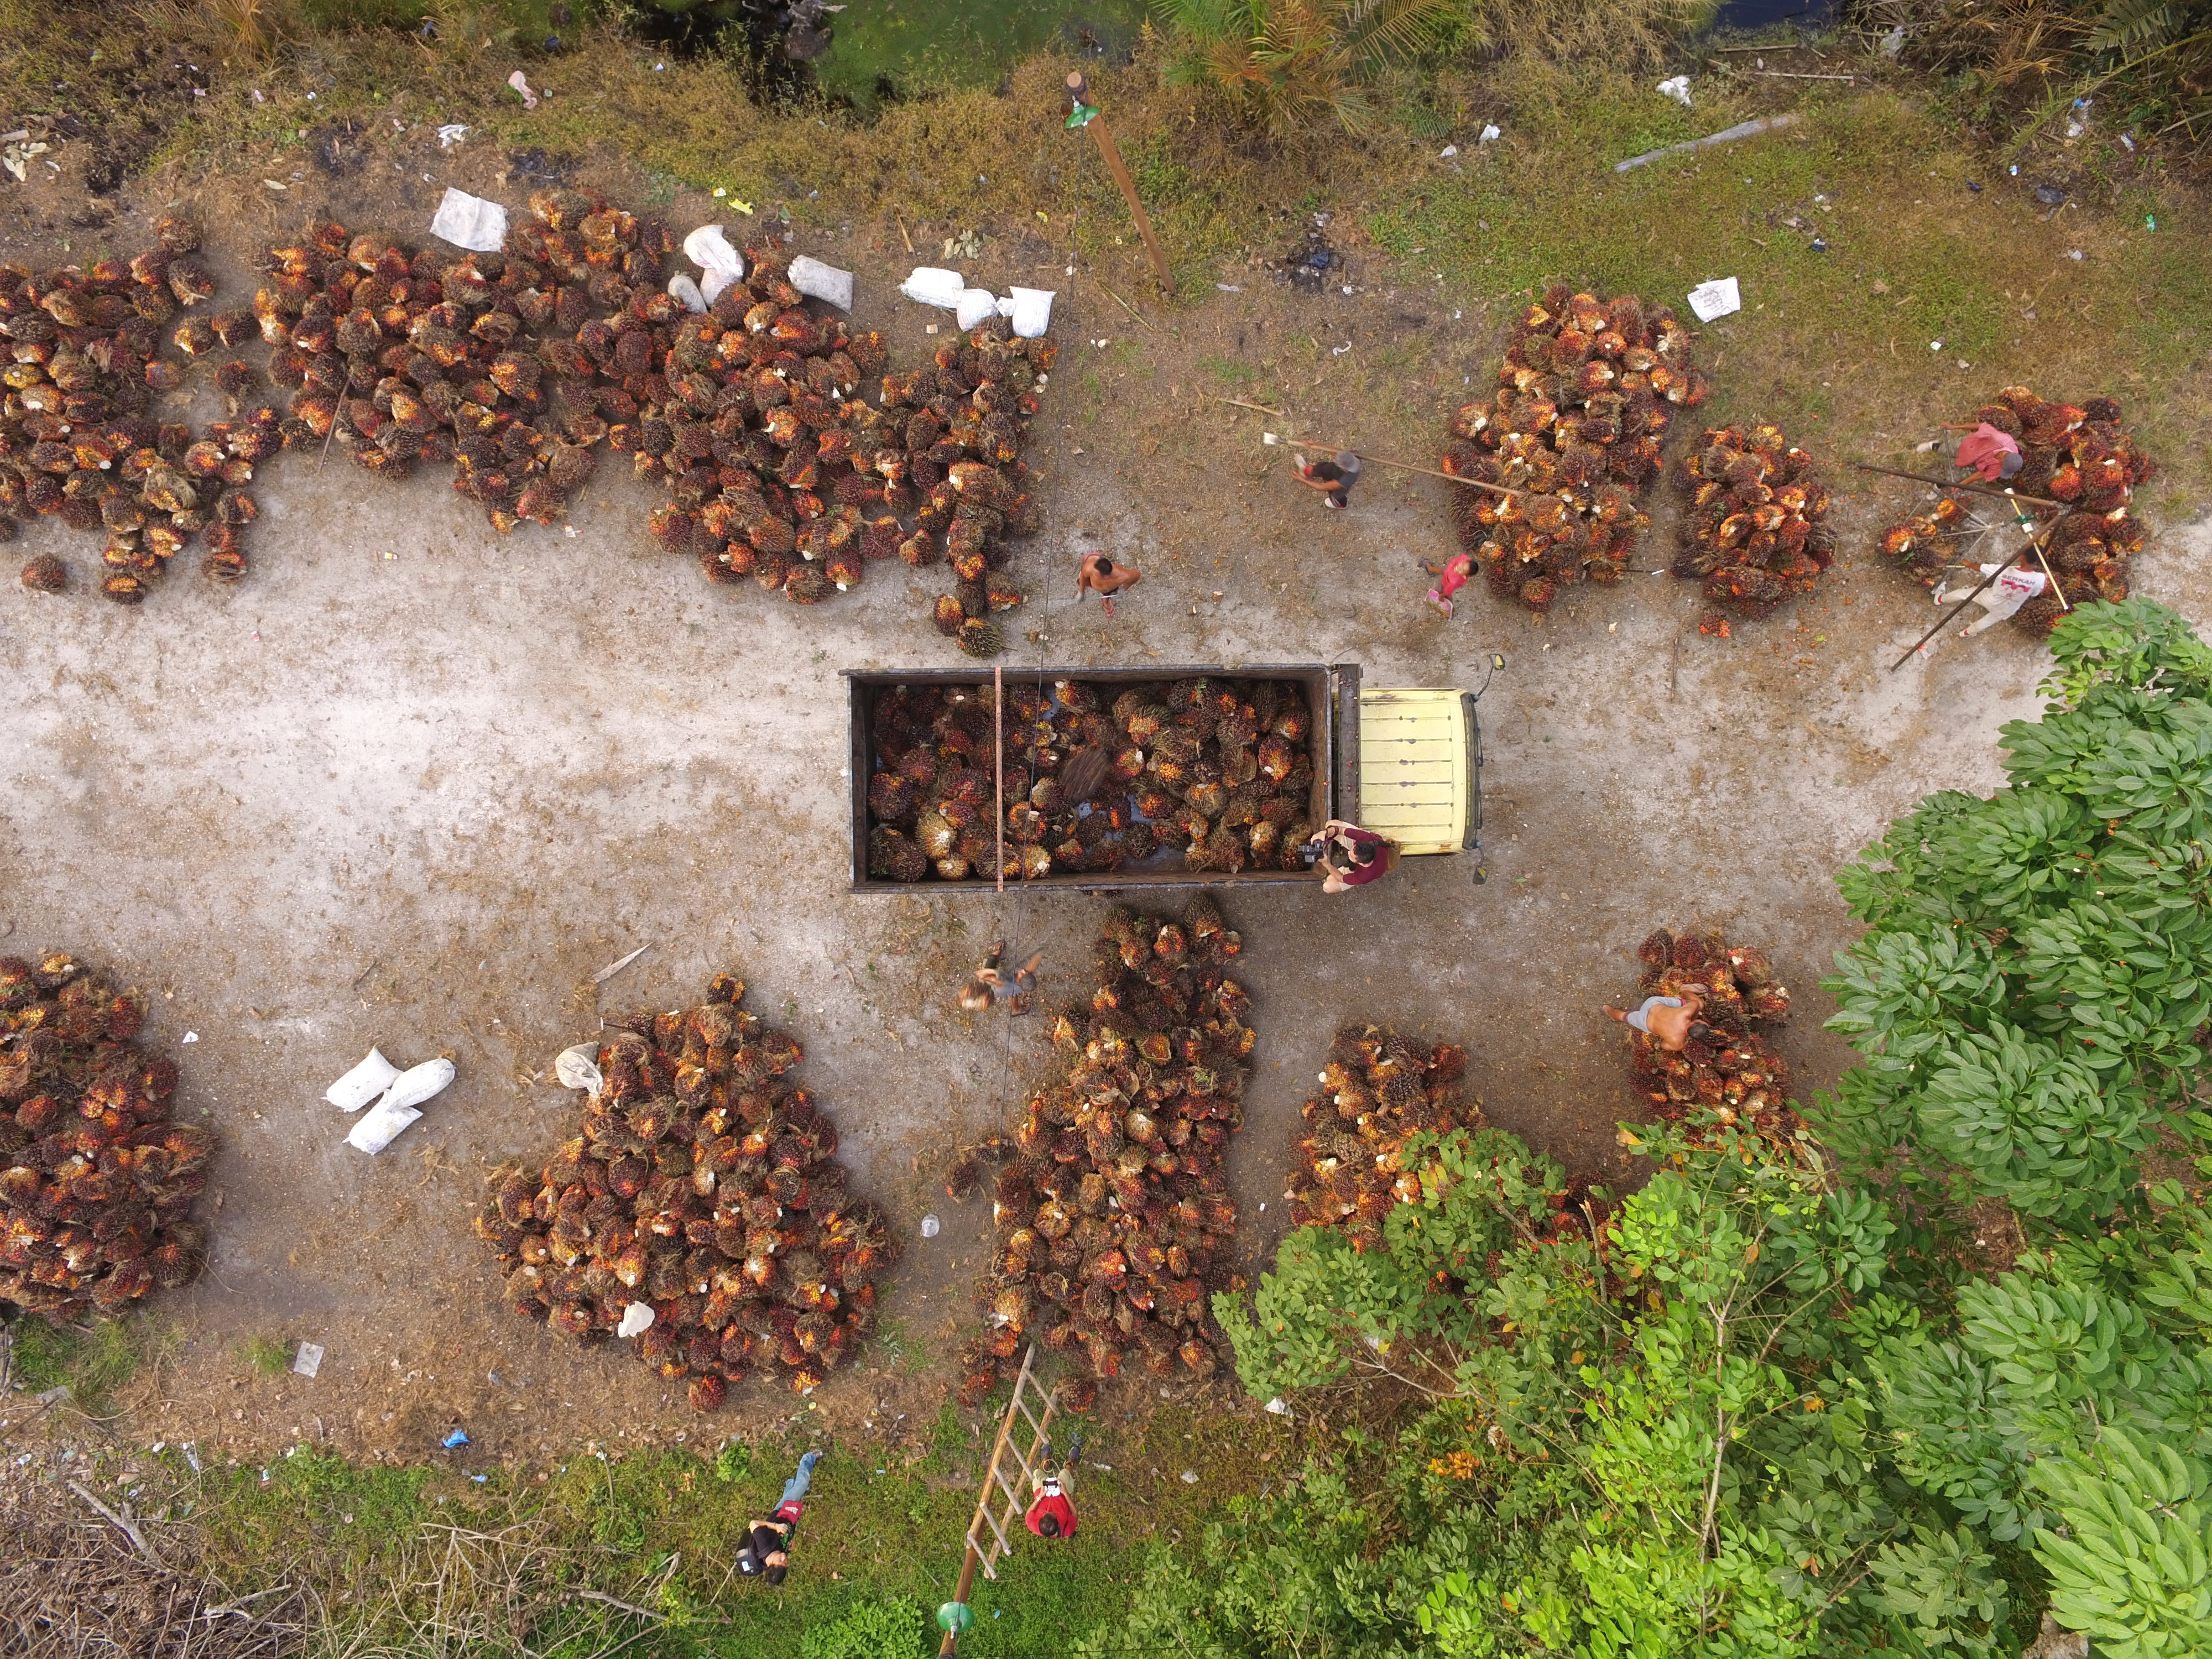
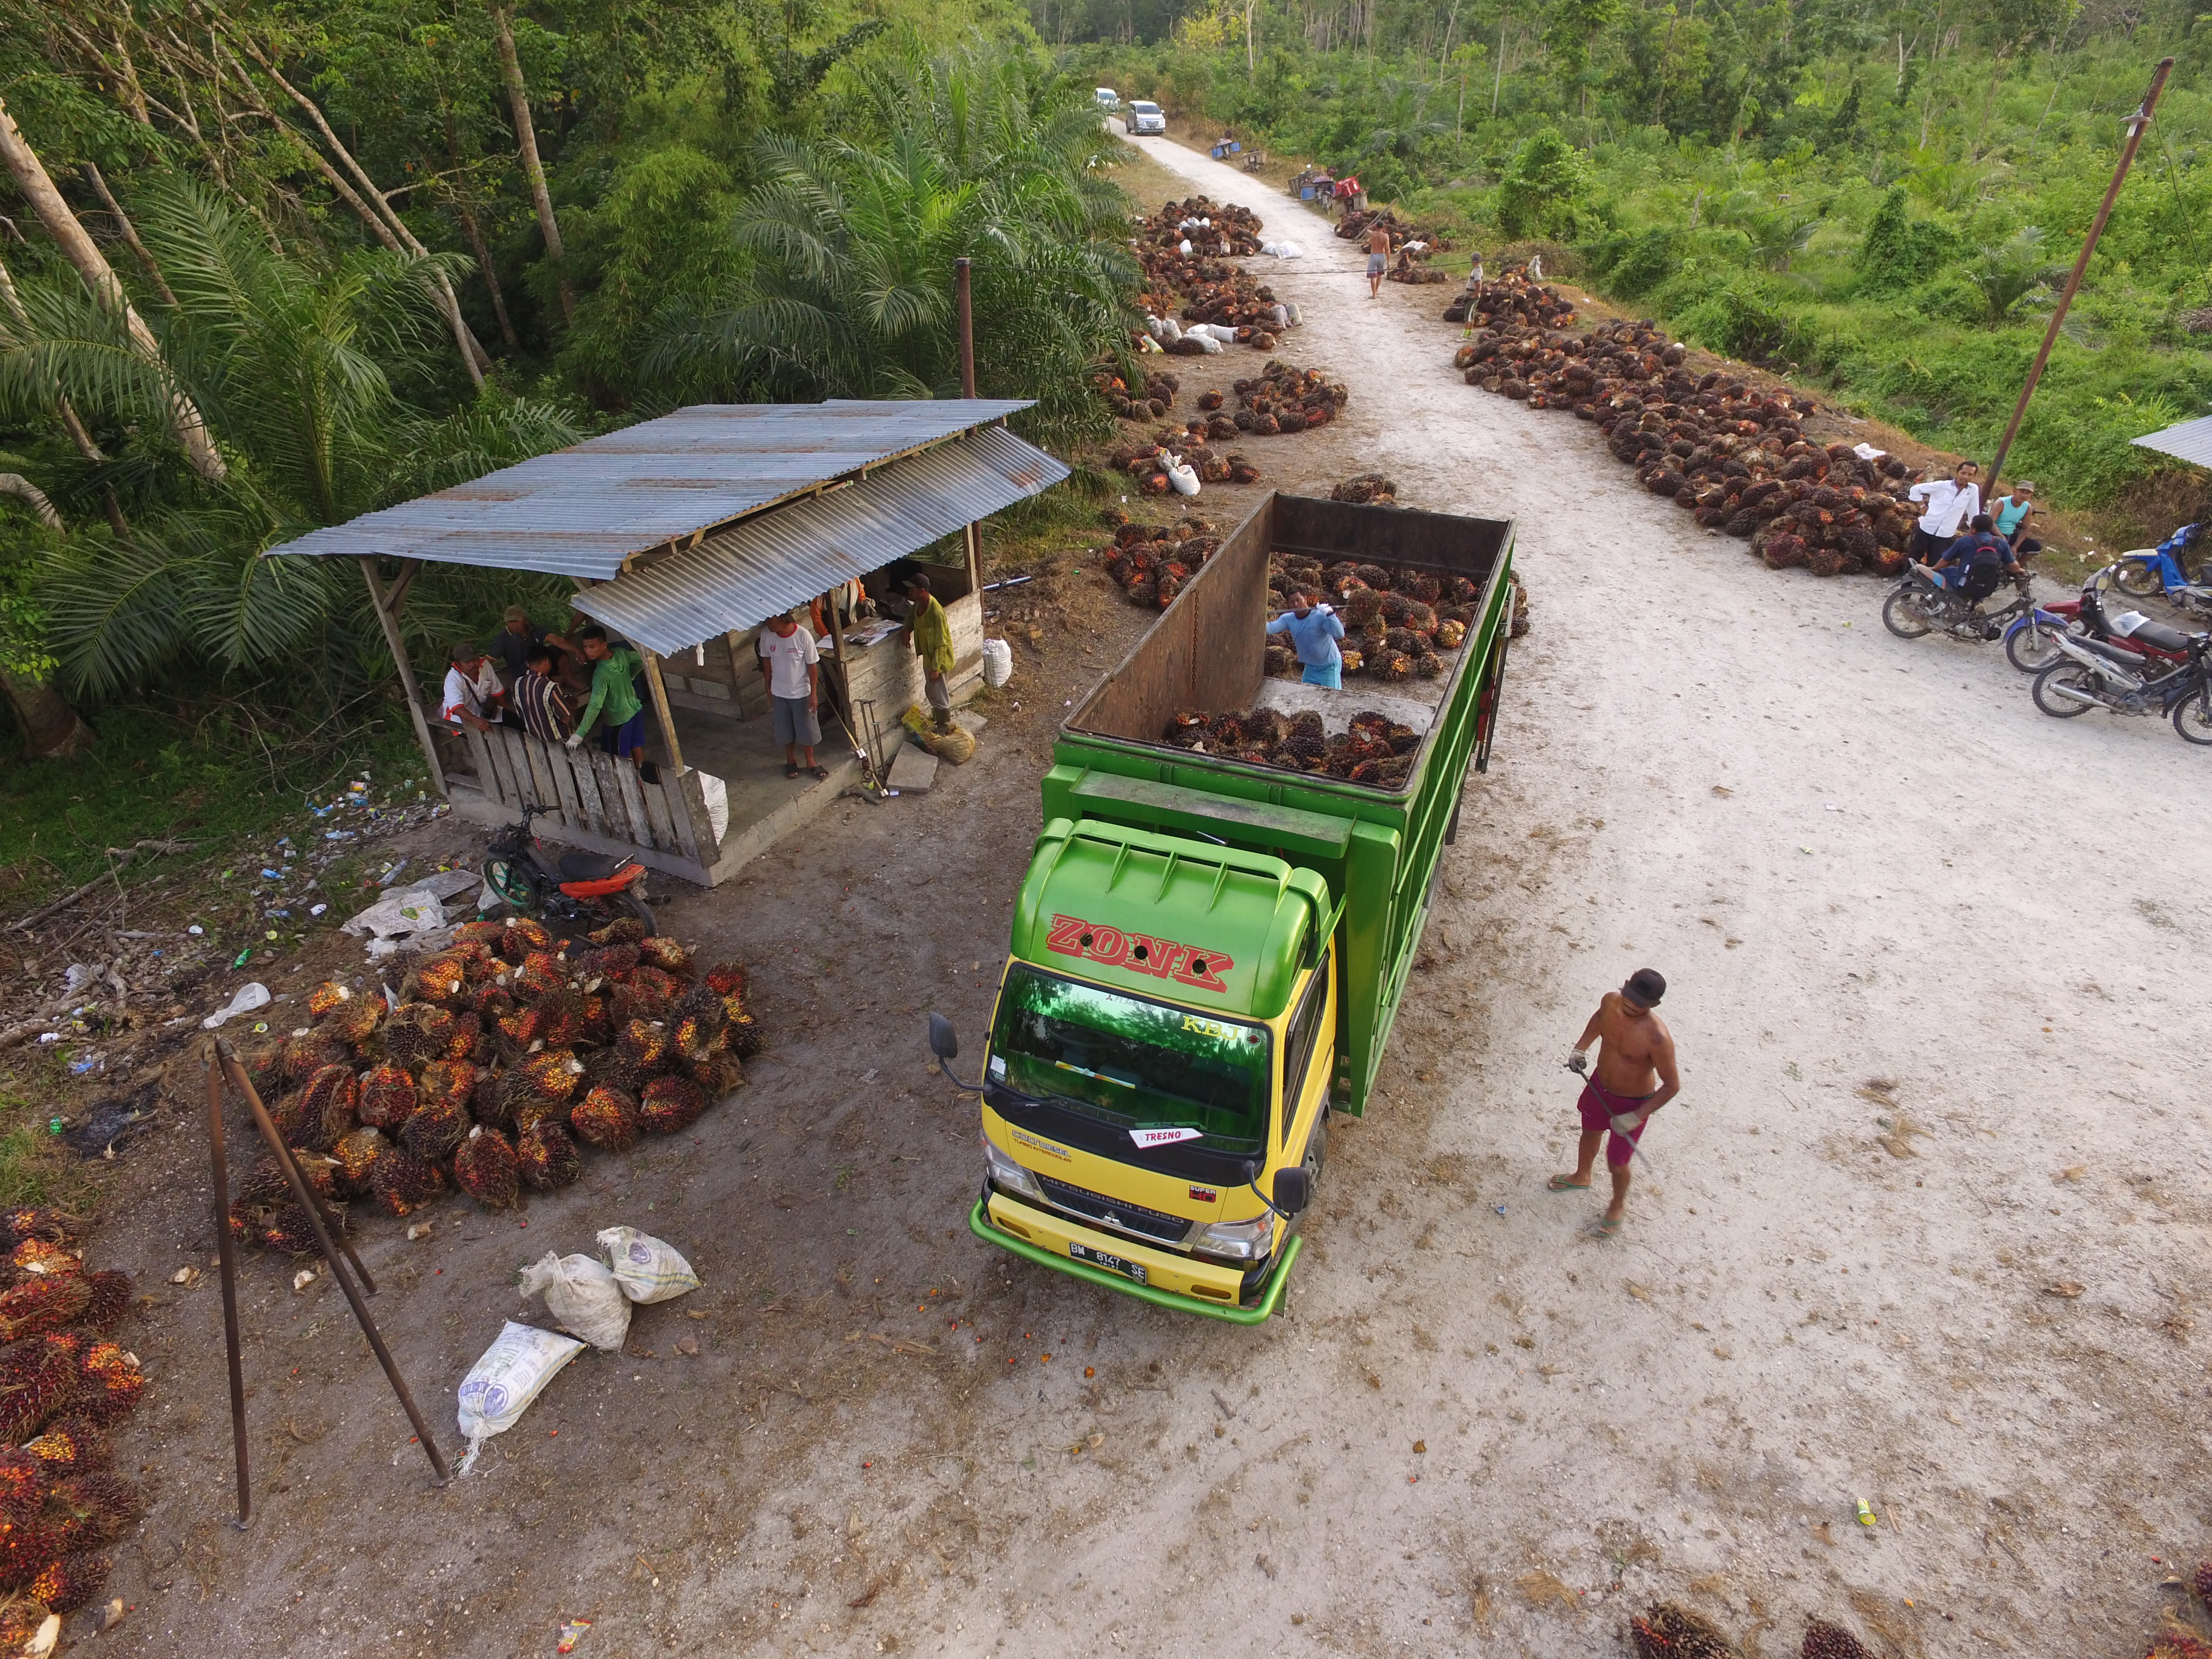 Truck loaded with palm fruit. Ridhwan Siregar/WRI Indonesia.
Companies and stakeholders can now use the publicly available UML on both GFW and the RSPO’s PalmTrace platform to improve the ease and accuracy by which they identify, manage and report mill data. Both the UML, and the comprehensive methodology on how this data is integrated into the UML, were designed in an effort to improve transparency and promote an industry-wide shift toward a single, harmonized set of information.
