Keeping an Eye on Cocoa: Satellite Monitoring Provides Key Support on No Deforestation Commitments
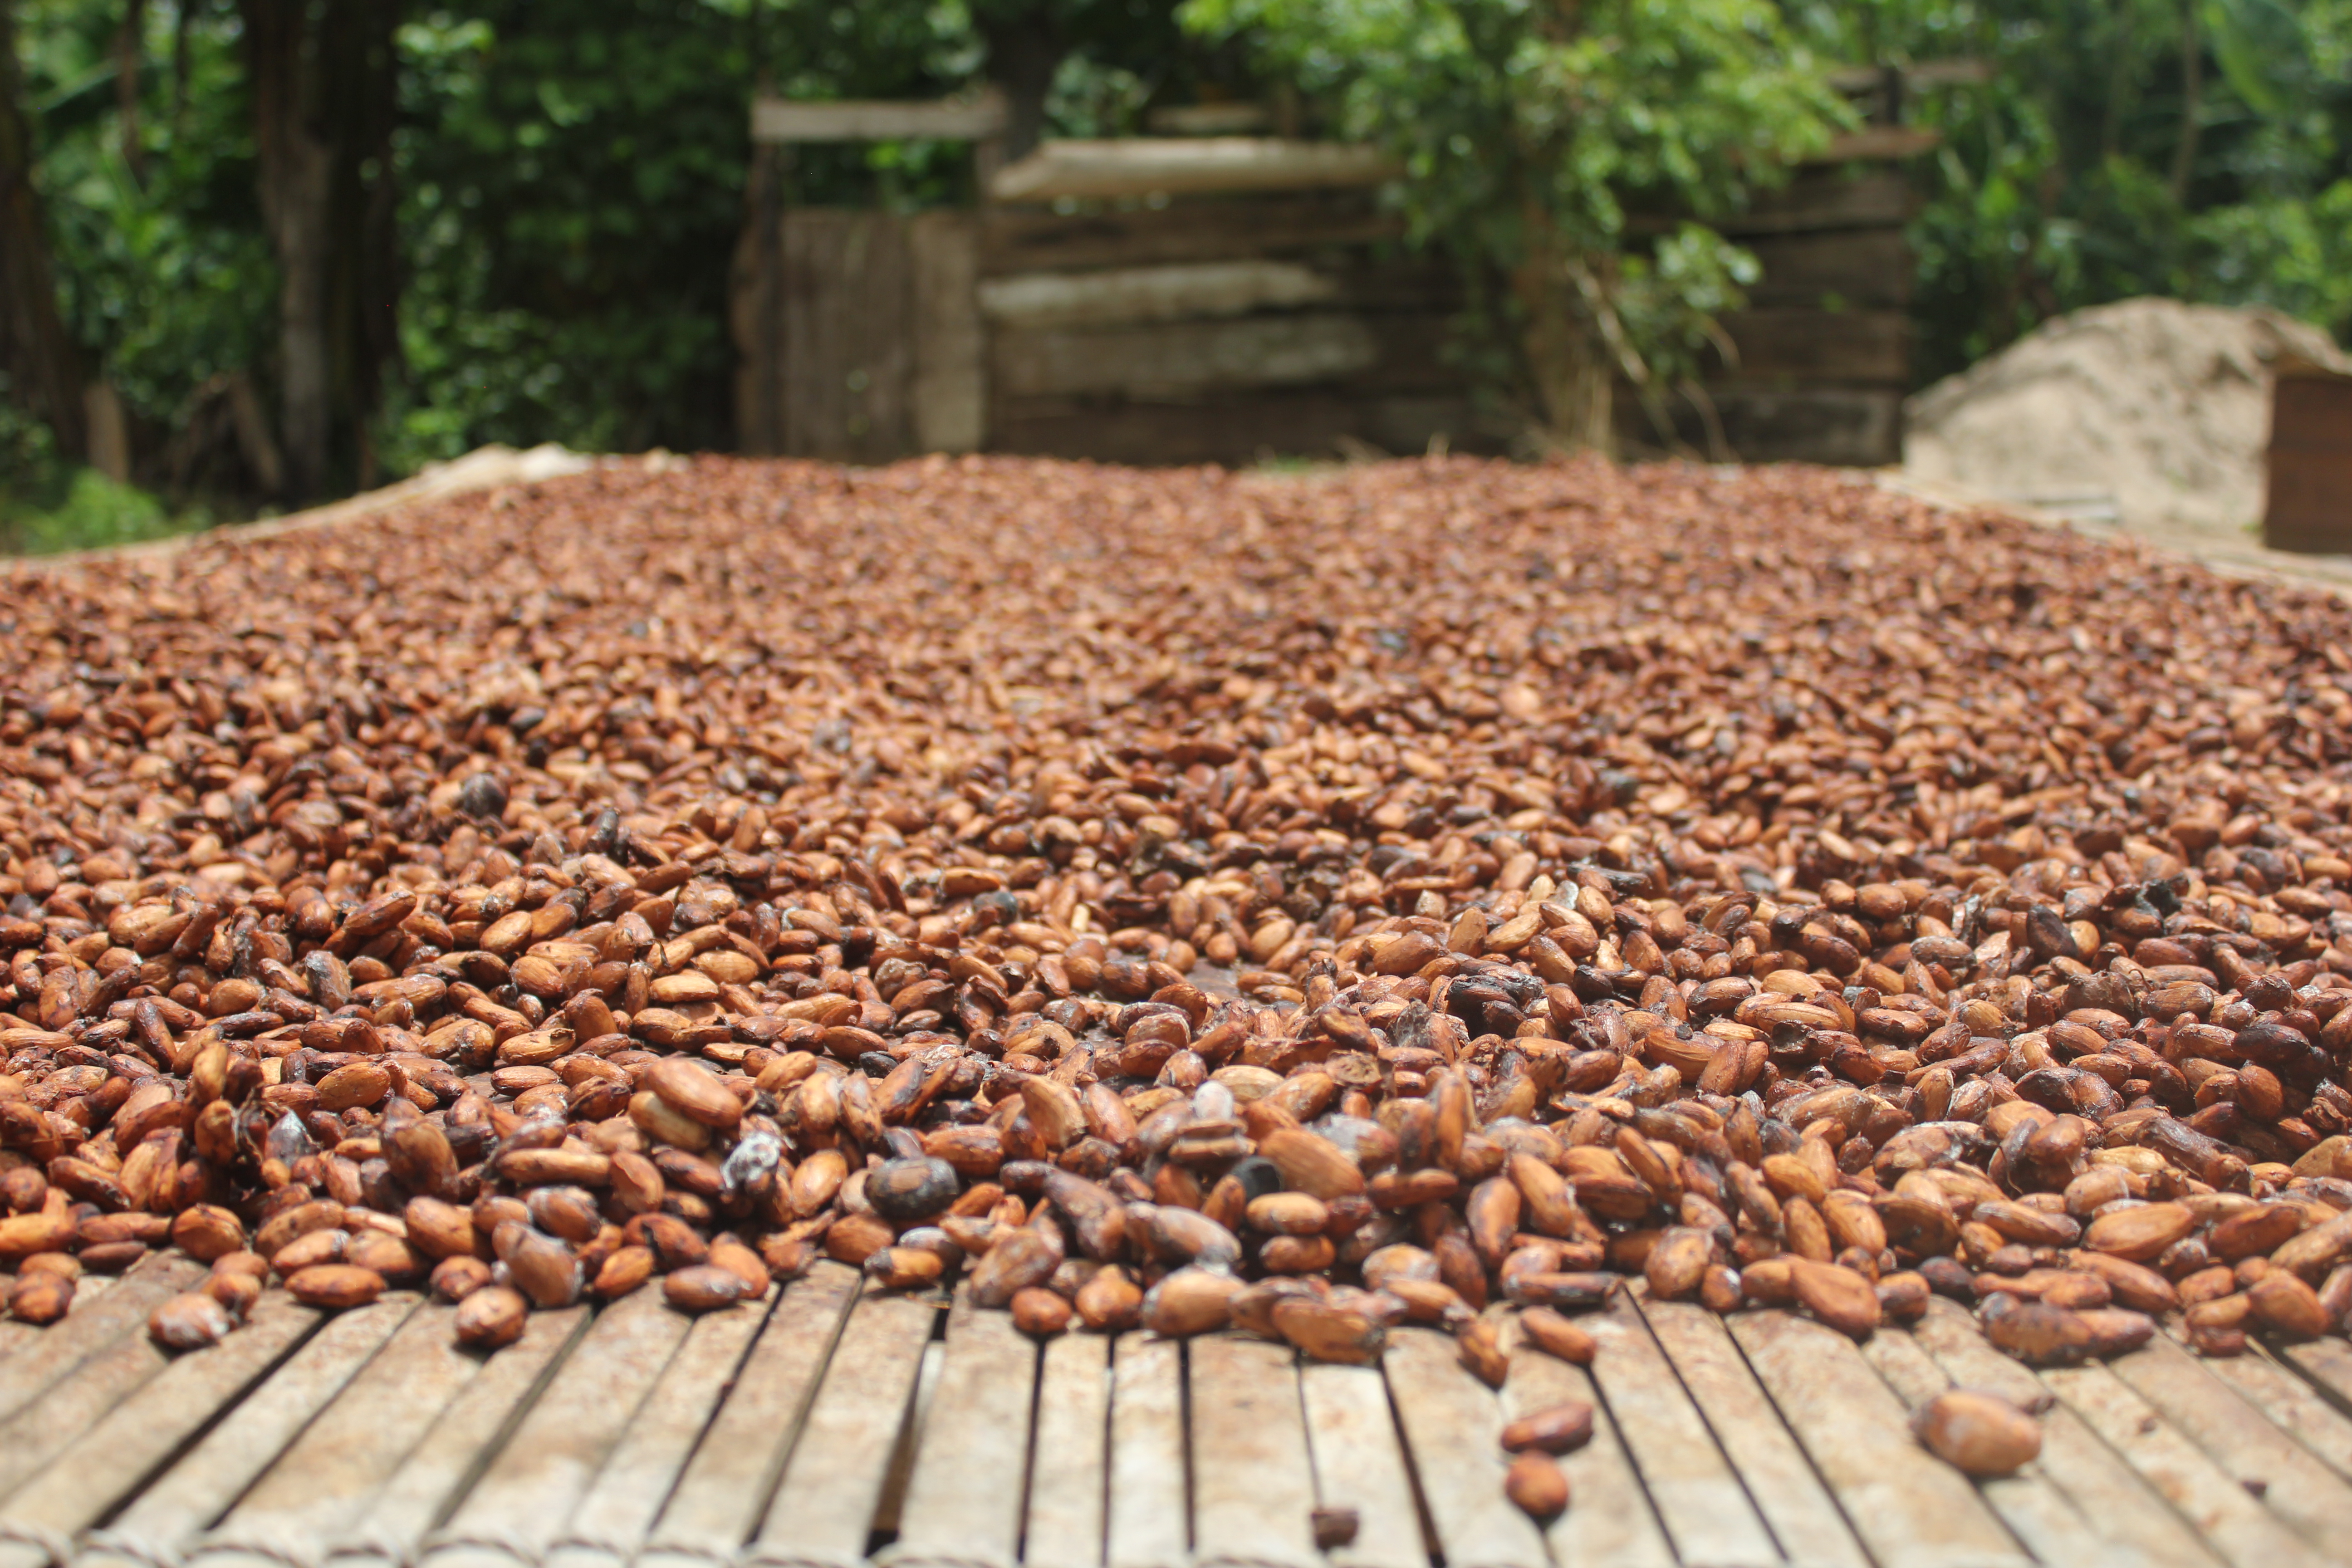
Ever wonder where the chocolate in your candy bar came from? With 70 percent of the world’s cocoa produced by Ghana and Côte d’Ivoire, chances are your midnight snack started out as a seed pod growing on a cocoa farm in West Africa.
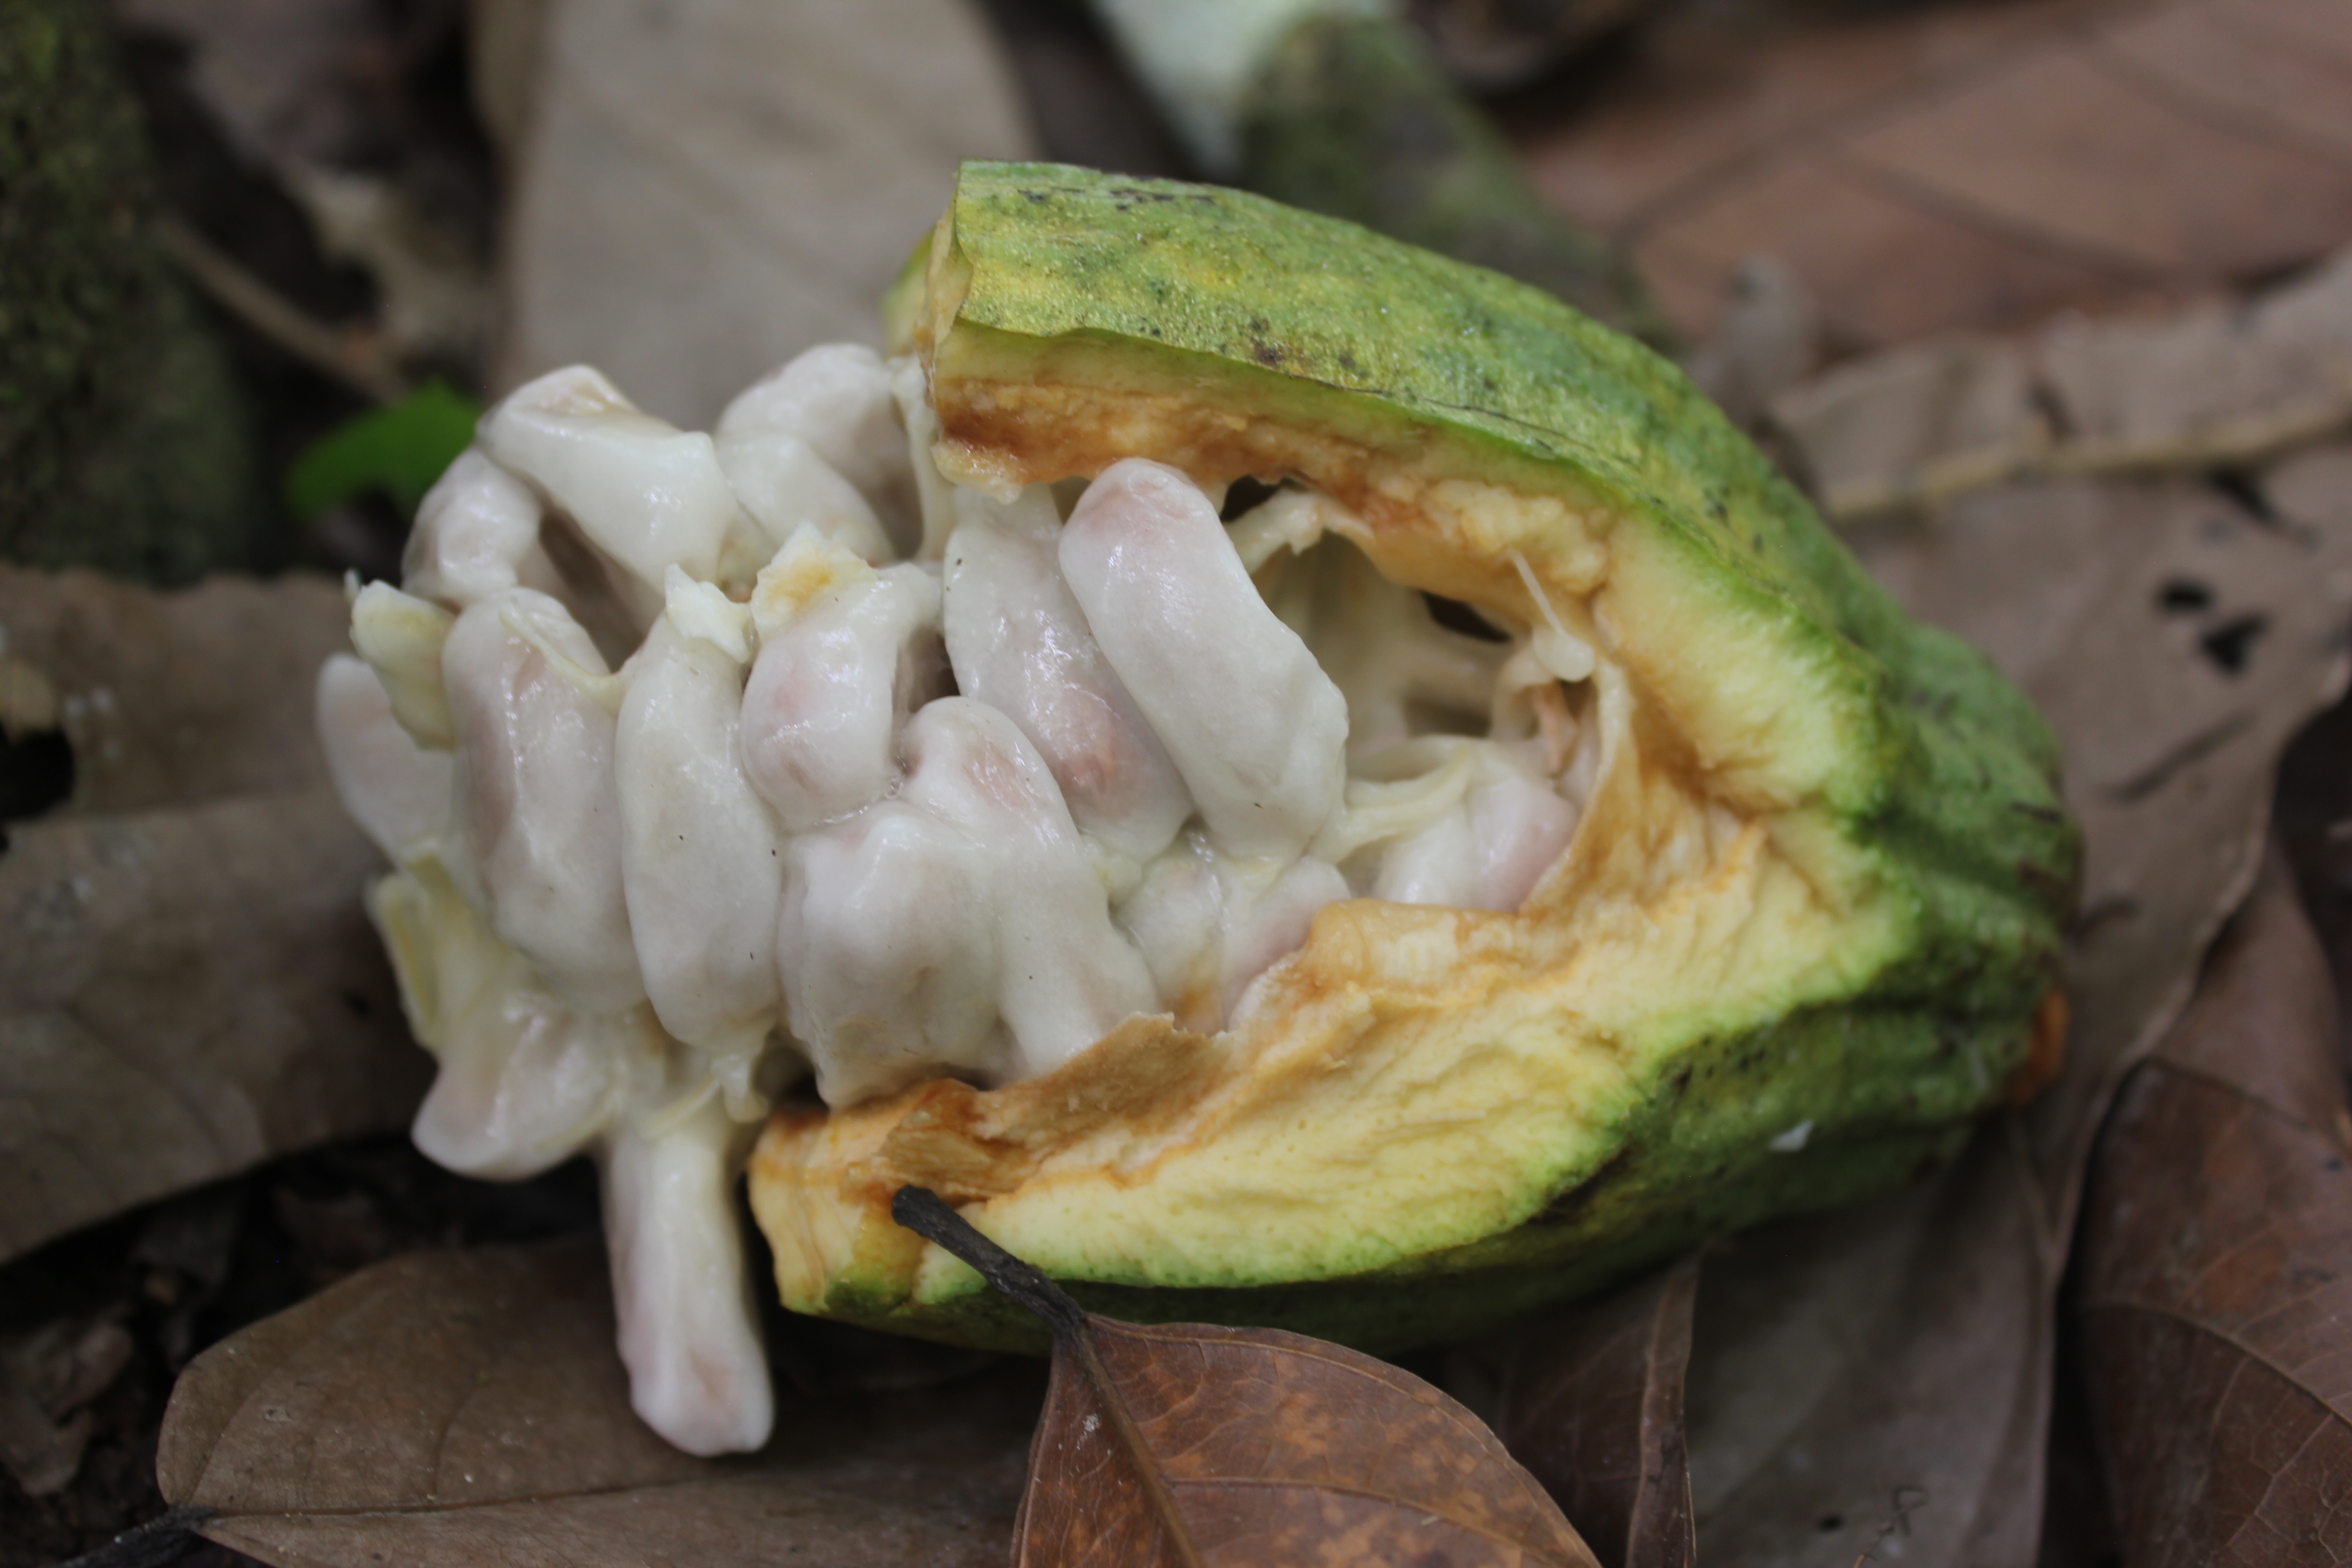 Chocolate is made by fermenting and drying the seeds of the cocoa pod. Photo by Caroline Winchester/WRI.
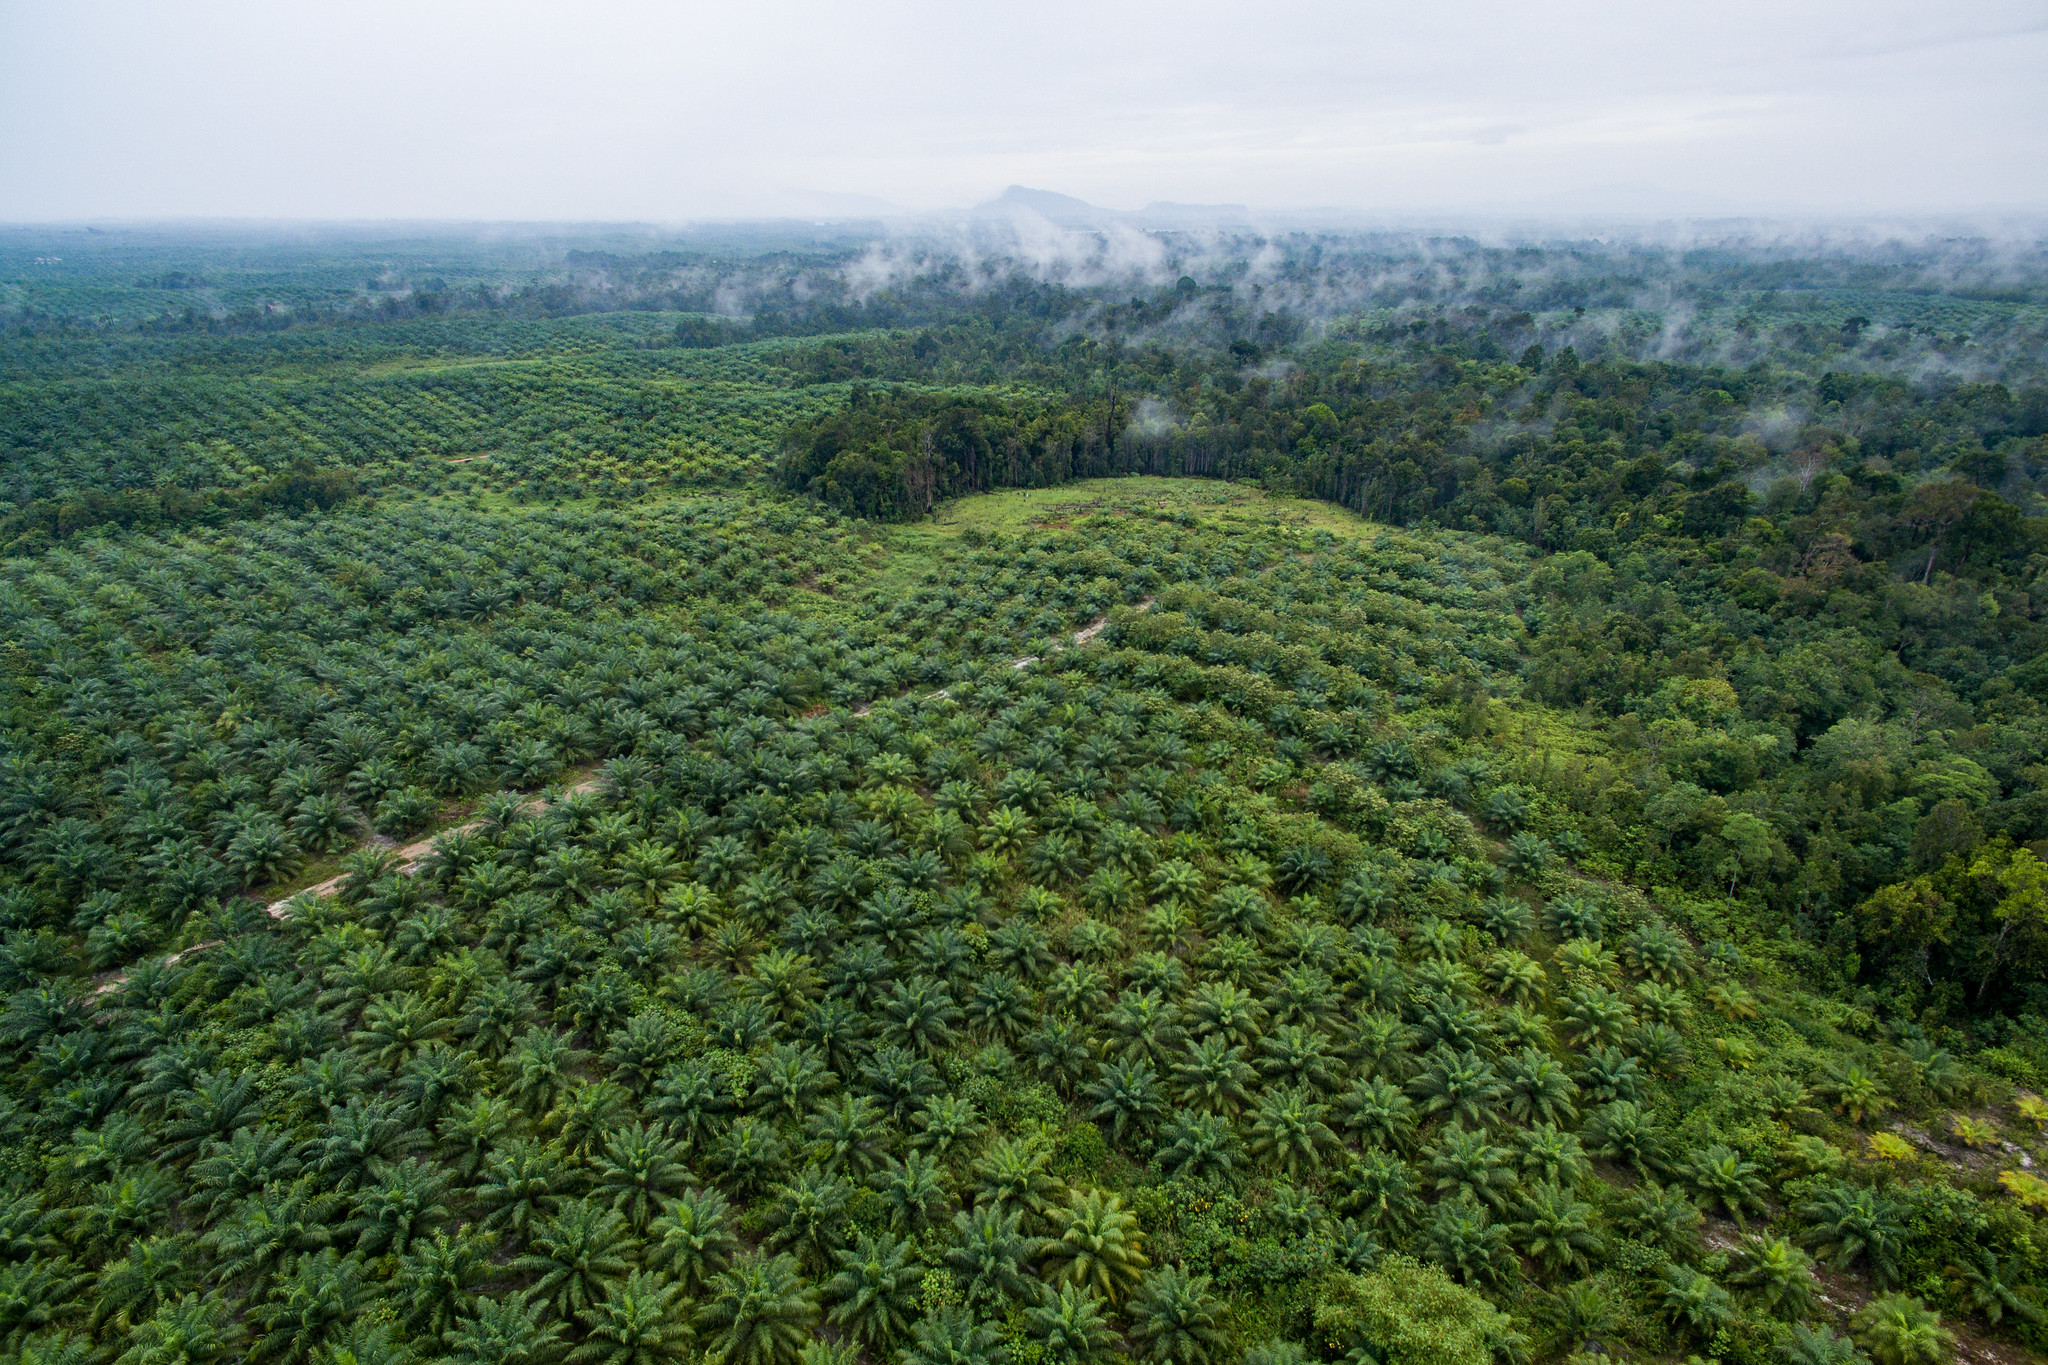
 West Africa is also home to the Upper Guinean rainforest, and like many other tropical areas where commodities compete with the environment for land, these forests have been threatened by the growth of the cocoa industry. Between 1988 and 2007 it is estimated that nearly 2.3 million hectares of the Upper Guinean rainforest were cleared to make way for cocoa farms. However, in 2017 the cocoa sector followed the example of commodities such as palm oil and soy in committing to eliminate deforestation from their supply chains through the launch of the Cocoa & Forests Initiative (CFI).
The CFI is led by the World Cocoa Foundation, IDH the Sustainable Trade Initiative and The Prince of Wales’ International Sustainability Unit. This initiative covers an estimated 80 percent of global cocoa usage and represents a pledge by both Ghana and Côte d’Ivoire as well as key cocoa and chocolate companies, to end deforestation and forest degradation from cocoa on any forested land. Specific areas to be protected, including national parks, are laid out within the Frameworks for Action for both countries.
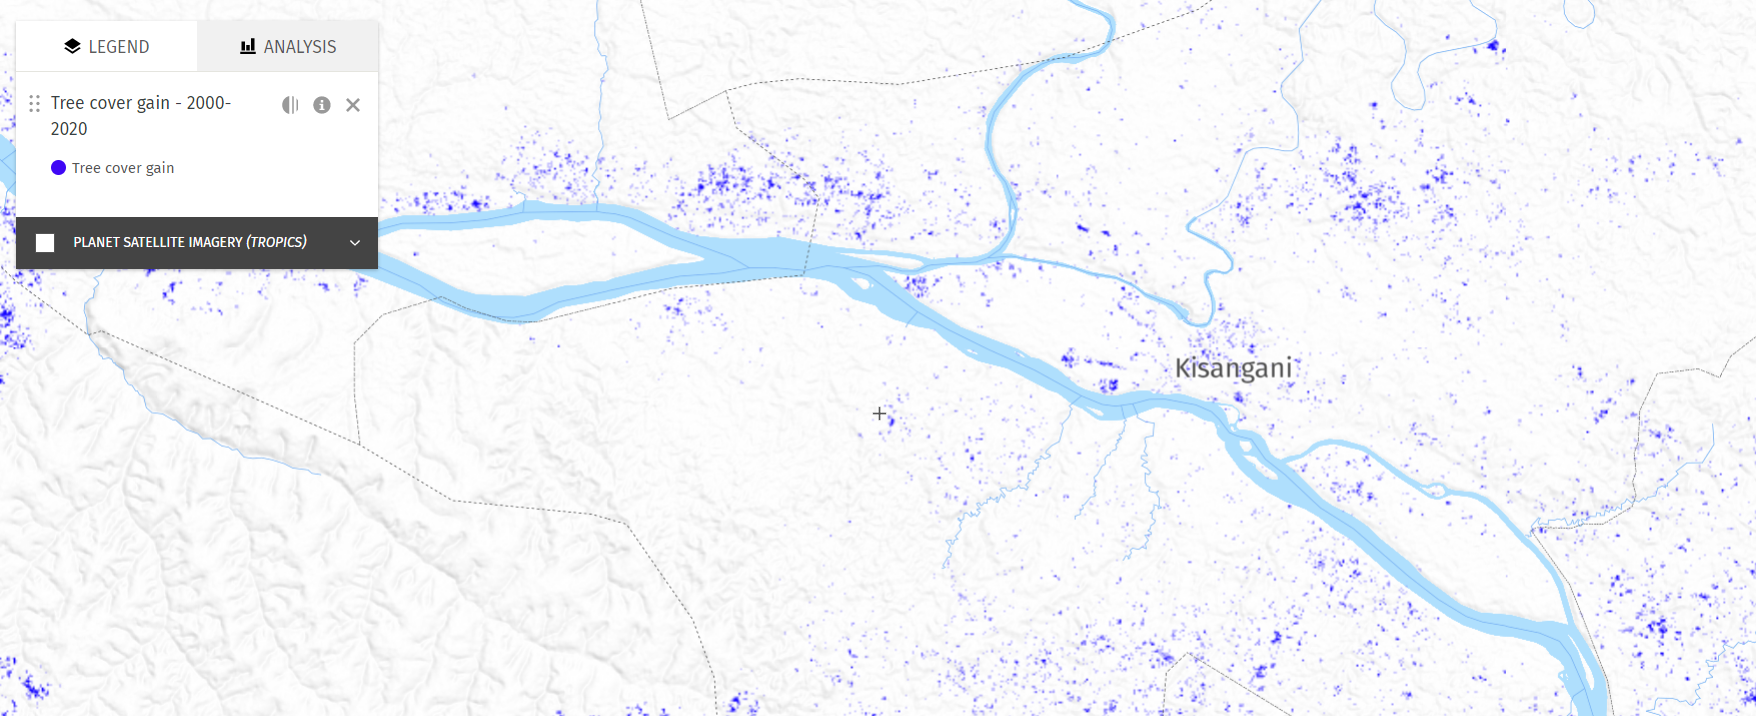
While this commitment is an impressive first step, it is only half the battle. In order to manage deforestation, CFI signatories must be able to detect where cocoa farms are expanding into forested lands so they can take appropriate mitigation measures. As part of the agreement, signatories committed to transparent satellite-based monitoring systems and publicly disclosed reports on progress towards their commitment to halt deforestation.
The World Resources Institute (WRI) has coordinated closely with the initiative to provide support on defining the needs of these monitoring systems, including datasets able to differentiate areas of cocoa production from natural forest and datasets which delineate the boundaries of national parks amongst other ecologically important areas. In addition to relevant datasets, a successful monitoring system needs a platform that can analyze and visualize this data to determine whether progress and key outcomes are being achieved. Such monitoring platforms are necessary at both the national scale to enable monitoring by governments, and supply chain scale for monitoring by companies.
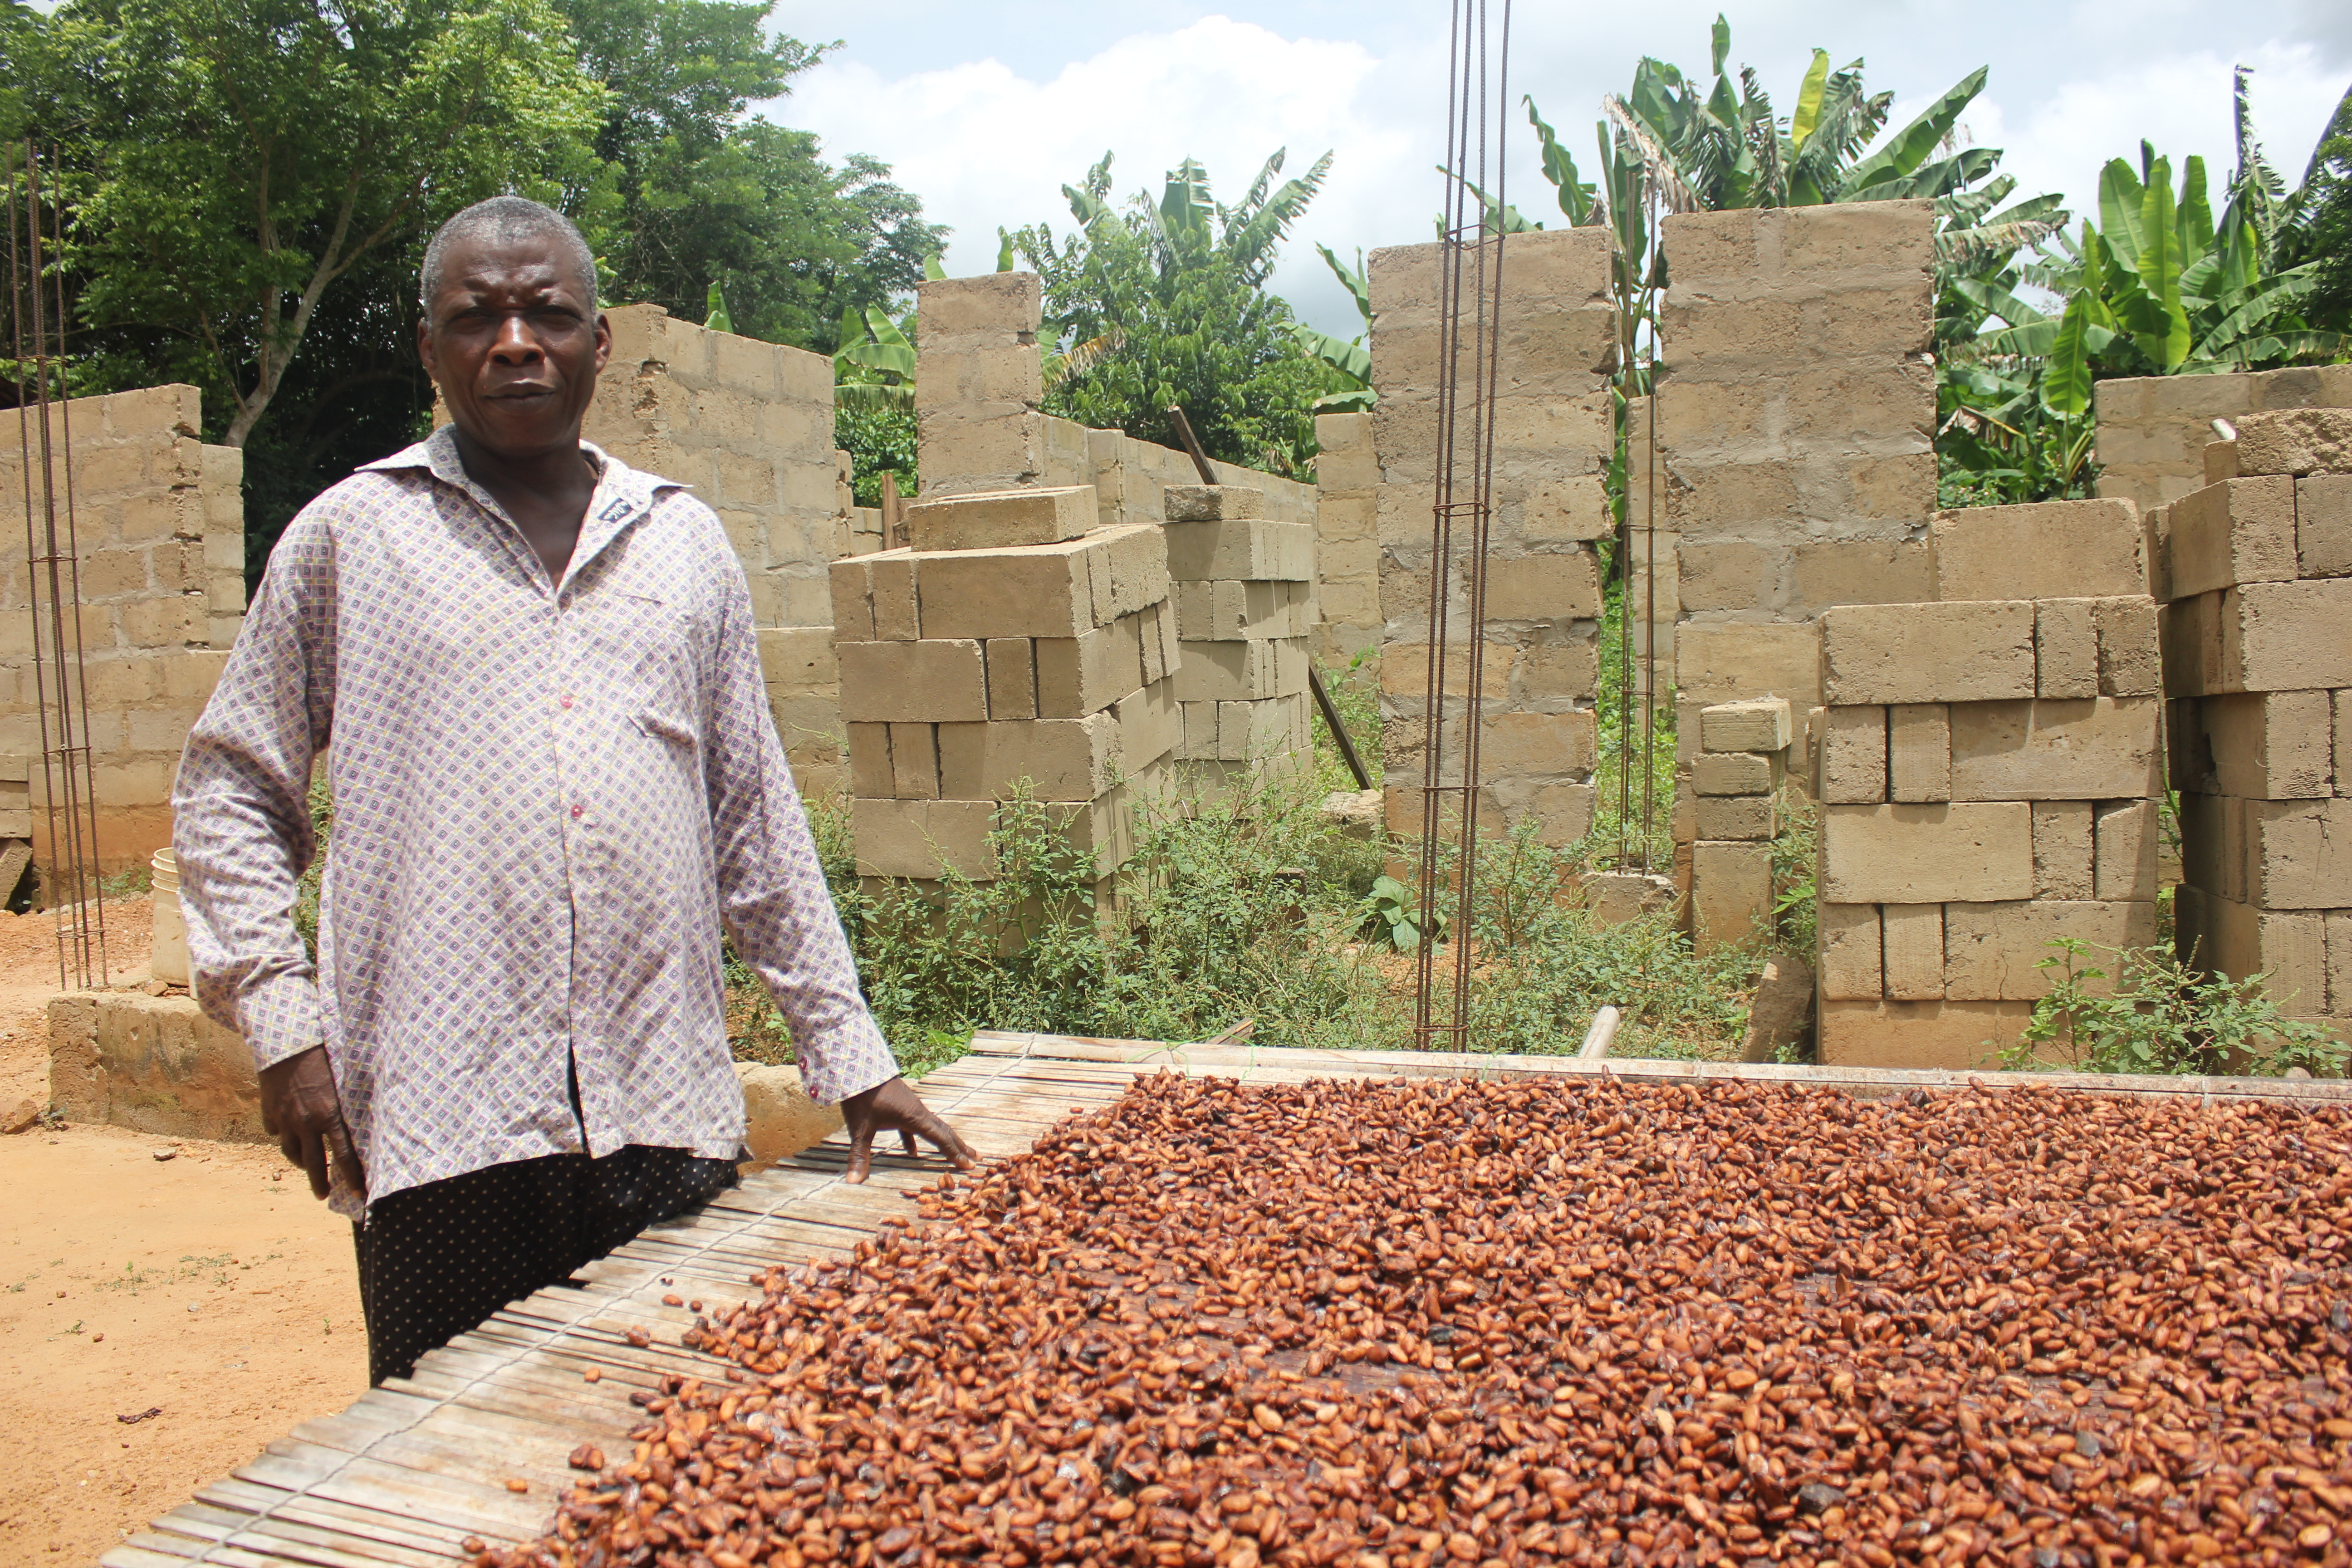 Most cocoa farms in West Africa are small-scale. Photo by Caroline Winchester/WRI
 What makes effective cocoa monitoring tricky however, is the way in which it is grown. Cocoa pods grow on trees and can be produced either in full sun or under the shade of larger trees. In addition, most cocoa operations are small-scale — an average cocoa farm in West Africa ranges in size from two to five hectares. This means that the spatial patterns that make a non-tree crop (like soy) more identifiable from above are much harder to detect for cocoa. Because of this, developing an automated and cost-efficient method of detecting and differentiating these farms is complicated.
Since 2017, WRI has directly supported cocoa and chocolate companies through its supply chain monitoring platform Global Forest Watch Pro (GFW Pro). The online platform allows companies to securely manage deforestation risk and track progress towards their no-deforestation goals. It enables companies to log into a private account, plot the location of thousands of farms and analyze these farms in relation to contextual information like tree cover loss and protected forests. This system has enabled companies including Cargill and Mondelez to prioritize engagement in risky areas where cocoa farms might exist near national parks or other protected areas. Companies can also produce reports for public disclosure in support of their sustainable cocoa policies and commitments.
GFW Pro also has the potential to support fully compliant CFI monitoring. Technology providers have begun to develop maps detailing areas of cocoa production, and WRI is working with these providers and CFI stakeholders in West Africa to assess options for integrating these maps and other national and regional datasets into GFW Pro to better meet the cocoa sector’s needs.
At present, GFW Pro is operating in a preview period during which WRI is working with over 50 partners to perfect the system before a public launch later this year. After public launch, supply chain actors around the globe will be able to create accounts and begin managing deforestation risk.
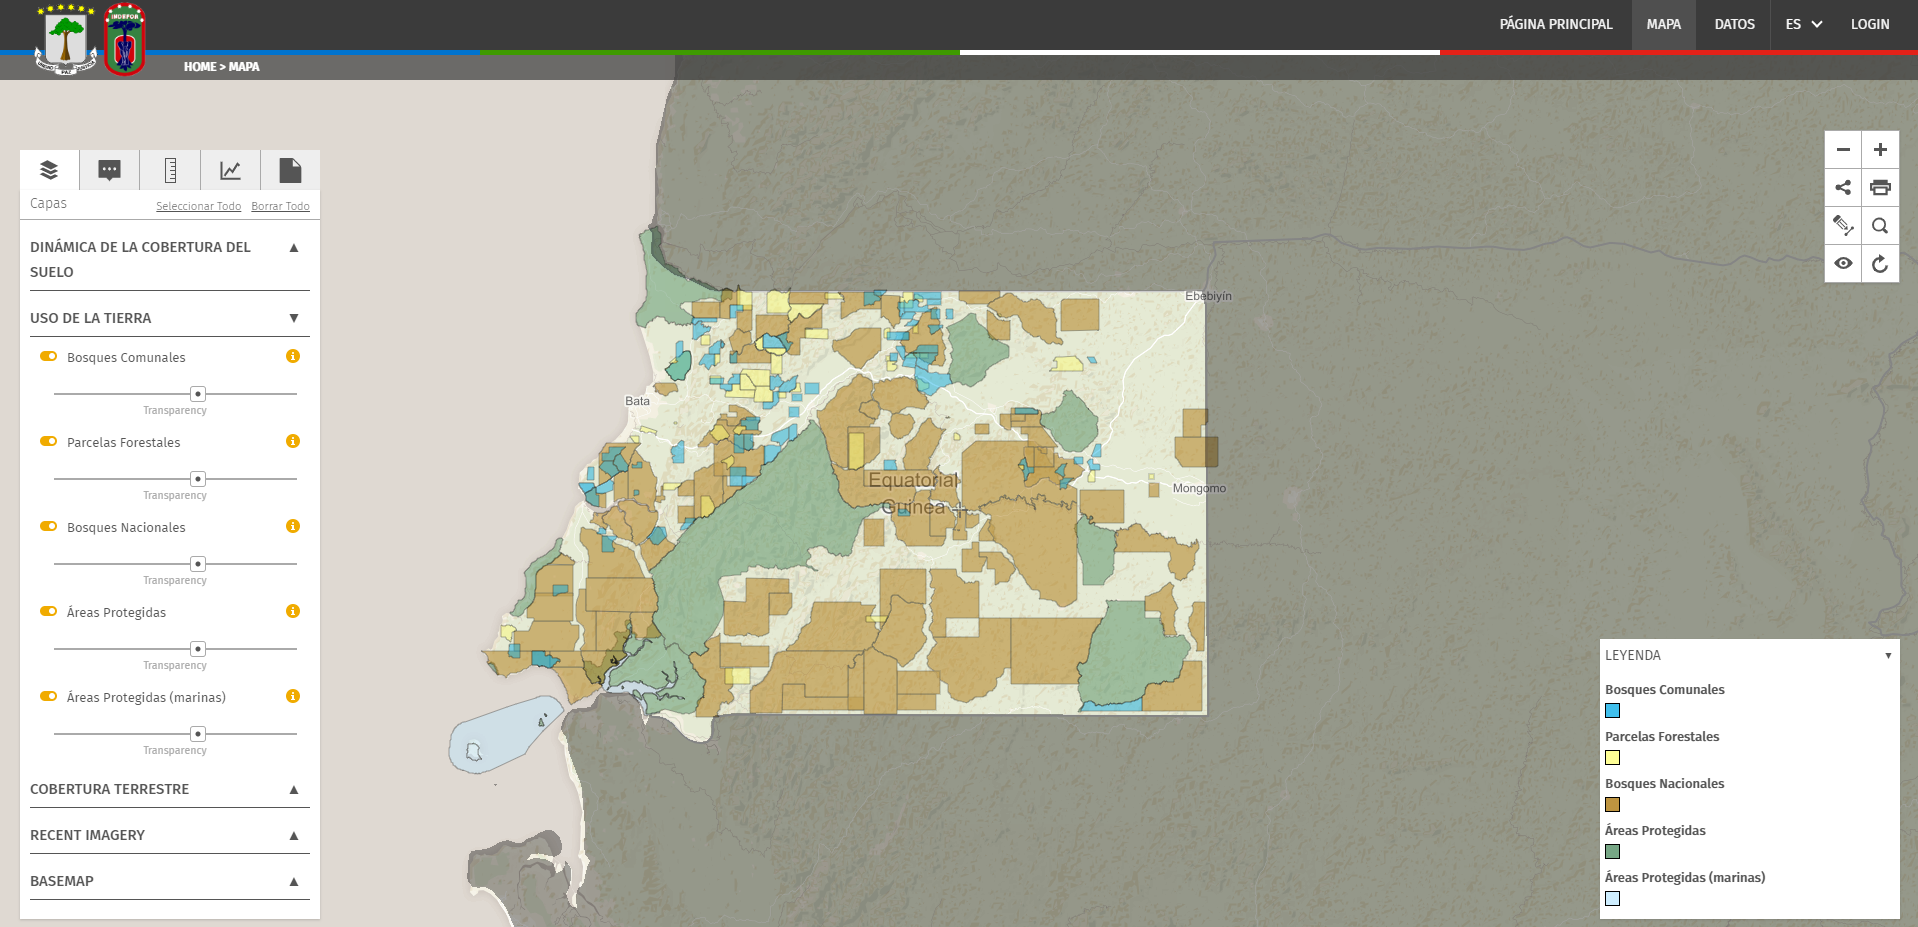 Forest Atlases are customizable in order to best suit each country’s needs.
 A model like WRI’s Forest Atlas, which provides freely accessible infrastructure for online platforms that are hosted within and owned by national institutions, offers a solution for cocoa monitoring at a national scale. By combining official government data on land use with national and global datasets on forest change, this platform could enable CFI monitoring and management by governments.
The CFI’s industry wide commitment to collaborative and robust monitoring solutions is a commendable first step in combatting deforestation. With monitoring systems in place, CFI signatories will be able to effectively measure and manage impacts from the cocoa sector. WRI looks forward to continuing to support positive change for West Africa and around the globe, so that consumers can rest easy knowing no forests were harmed in the making of that chocolate bar.