New Data on Global Forest Watch Distinguishes Natural Forests from Other Tree Cover

It’s well established that forests are important for people, nature and climate, but not all forests are created equal. Natural forests tend to harbor more biodiversity and offer a wider array of ecosystem services than planted forests, and therefore keeping natural forests standing is particularly critical.
The tree cover data available on Global Forest Watch (GFW) includes all types of tree cover, including natural forests and planted trees such tree crops and wood fiber plantations. Although data on primary forests are available for the humid tropics, distinguishing natural forests globally from other types of tree cover previously required overlaying multiple data sets to exclude areas that are not natural forests.
Now, new natural forest data on GFW from the Science Based Target Network (SBTN) Natural Lands Map can help shed light on where the world’s natural forests are located and provide a baseline for monitoring loss within them since 2020.
What is the Science Based Target Network Natural Lands Map?
Land & Carbon Lab collaborated with WWF and Systemiq to develop the Natural Lands Map to support companies who have committed to eliminate conversion of natural lands in their supply chains through targets set with the SBTN land sector framework. The map provides a 2020 baseline of natural lands that companies can use to see where production activities have caused conversion since 2020, as well as identify and prevent future risk of conversion.
The Natural Lands Map includes several classes of natural land cover. The natural forest layer on GFW is a subset of the SBTN Natural Lands Map that includes the natural forest class and relevant subclasses, including wetland forests, mangroves and peat forests.
The Natural Lands Map was created by combining the best available global and local land cover and land use data sets into a single harmonized map at 30-meter resolution circa the year 2020. This includes data sets such as the University of Maryland GLAD Lab’s 2020 land cover data set, various data sets on cropland and planted trees, and local data sets such as MapBiomas in South America and Indonesia, among others. The various input data sets were selected based on accuracies reported from the data producers when available and alignment with the definitions used by SBTN. Input data sets were combined to create the final Map.
How does the Map define natural forests?
SBTN uses the Accountability Framework Initiative (AFi) definitions of natural ecosystems and natural forests to align with other standard setting initiatives. AFi adopts the Food and Agriculture Organization (FAO) definition of forests: land spanning more than 0.5 hectares with trees higher than 5 meters and a canopy cover of more than 10%, or trees able to reach these thresholds in situ, not including land that is predominantly under agricultural or other land use. AFi then differentiates natural forests as those where the species composition, structure and ecological function do not show effects of major human impacts.
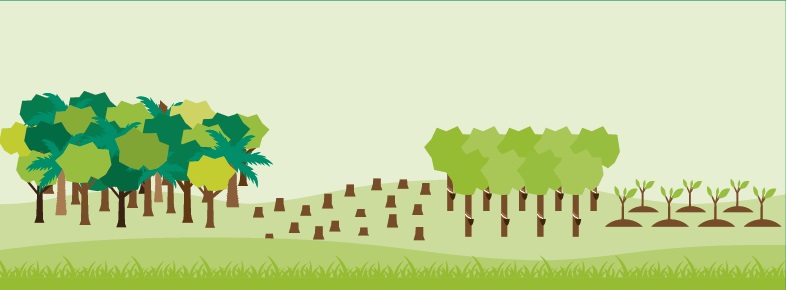
Because satellite data cannot directly map all the elements of these definitions, the data development team operationalized them using proxies based on available data to exclude tree cover that would not meet the natural forest definition. Non-natural tree cover may include tree crops (e.g., palm oil, orchards, cocoa), planted forests (e.g., eucalyptus, teak, or pine plantations), patches of trees under 0.5 hectares, or trees within areas predominantly under agricultural or urban land use (e.g., trees planted within agricultural fields or within small urban parks). Natural forests may include primary, secondary or naturally regenerating forests, and may include some forms of low-intensity management.
AFi guidance states that quantitative thresholds established by national and sub-national forest definitions may take precedence over the global definitions, so local maps were given priority over global data in select regions.
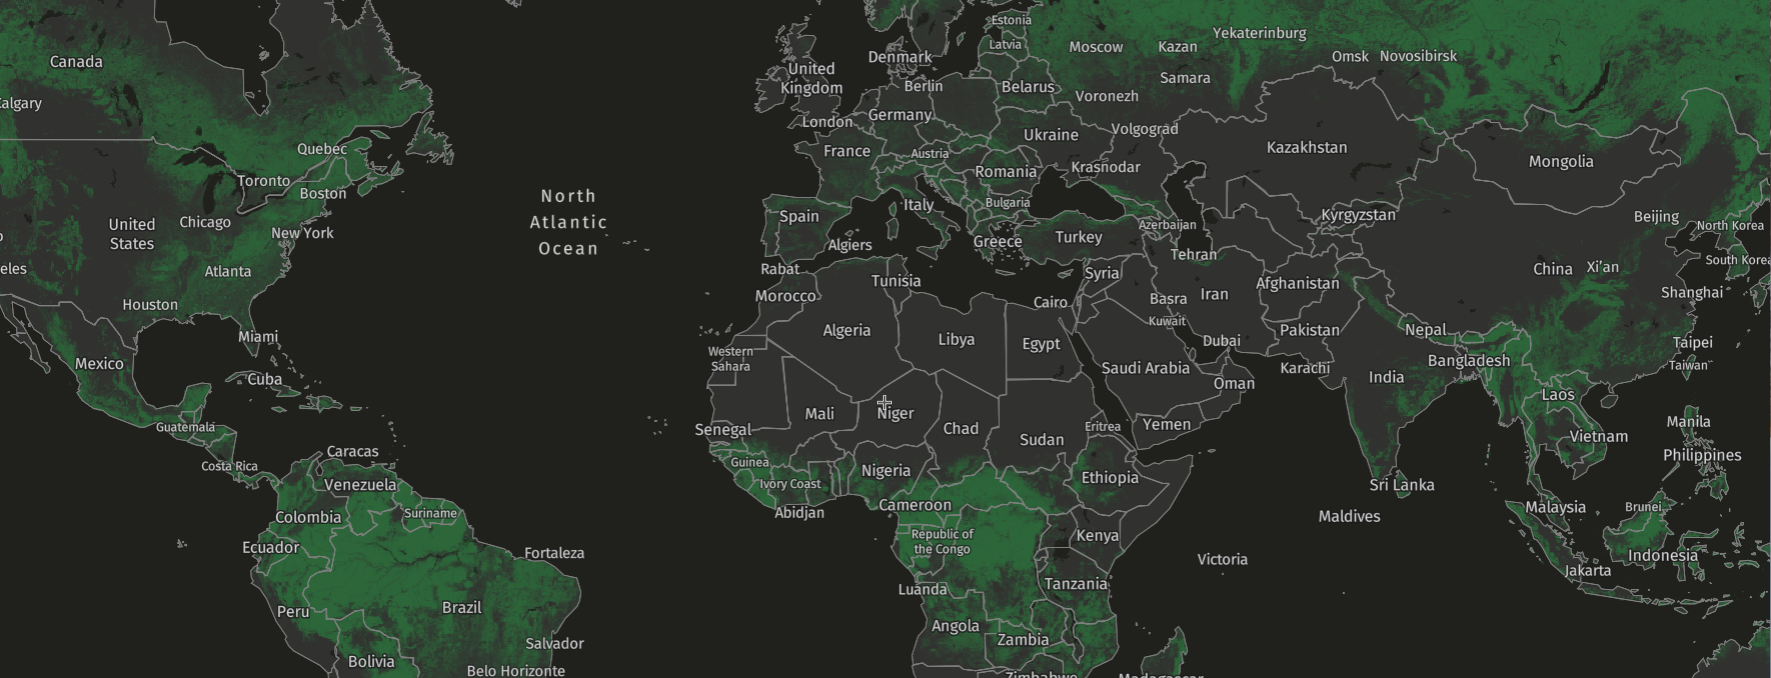
The natural forest map distinguishes natural forests from other tree cover
What data is available on Global Forest Watch?
The natural forest layer now available on the GFW map includes all natural forest subclasses from the SBTN Natural Lands Map (version 0.3). This natural forest layer has an overall accuracy of 88%.*
Previously, GFW users could analyze tree cover loss within and outside of the Spatial Database of Planted Trees, which helped identify which losses were more likely to represent plantation harvesting or tree crop rotation. Now, the GFW dashboard allows users to separate tree cover loss in natural forests and non-natural tree cover from 2021 onwards using the natural forest map, meaning users can specifically monitor loss of natural forests around the world. This provides users with a more comprehensive and improved method to estimate loss in natural forests that is more aligned with widely accepted definitions.
Users can also now calculate the area** of natural forest, non-natural tree cover and other land cover within administrative boundaries and other land use categories, such as protected areas.
How can this data be used?
The natural forest layer can be used to assess the extent of natural forest in 2020, and can be combined with additional data, such as tree cover loss, to monitor loss of natural forests from 2021 onward in a user’s area of interest. For example, companies can use the data to assess whether their production or sourcing activities have caused deforestation since 2020, or if their future plans pose a risk of deforestation, for tracking progress under voluntary commitments or the European Union Deforestation Regulation (EUDR).
For any use case however, users should consider the definitions used for the natural forest layer and determine whether these definitions align with their monitoring needs. For example, there is a key difference in how AFi and EUDR define deforestation that users must consider: while AFi defines deforestation as conversion of natural forest to non-natural tree cover or another land cover, EUDR defines deforestation as the conversion of any type of forest — including planted forest — to agricultural use. Because the natural forest layer does not include planted forest, users may need to use additional data to include planted forests in their forest baseline to monitor conversion of natural and planted forest to agriculture for EUDR purposes.
For a full description of how the natural forest map relates to EUDR, see this blog. For more information on EUDR definitions and how GFW can support EUDR monitoring, read part one and two of our blog series.
Whenever using the SBTN Natural Lands Map, including the natural forests map on GFW, users should also be aware of a few limitations of the data:
- Overestimation of natural forest in agroforestry systems and in temperate and boreal forests: Agroforestry systems, especially those where crops are grown under shade trees (such as some types of coffee and cocoa systems), are difficult to differentiate from natural forests in satellite imagery, and therefore available data on their extent is limited. Similarly, publicly available data on planted forests is limited in many temperate and boreal regions. As a result, these areas may be included as natural forest in the Map.
- Inconsistent forest definitions in certain regions: Because the SBTN Natural Lands Map team prioritized local and regional input data over global data during the compilation and harmonization process when the Map was developed, there may be inconsistencies in the height and canopy density thresholds used to define forests in some regions where local data was used, including Brazil, the Amazon, Atlantic Forest, Pampa, Chaco, Indonesia, South Africa and New Zealand.
- Temporal inconsistencies: The Map is as close to the year 2020 as possible, but due to limited data availability, some input data is from earlier time periods (e.g., 2015).
- Resolution inconsistencies: Most input data used to create the Map is at least 30-meter resolution, but in some cases lower resolution data was used when higher resolution data was unavailable. These inconsistencies create data artifacts (sharp boundary lines that are only due to resolutions) in some areas.
See more information on these limitations in the technical documentation.
What’s next for the natural forest data on GFW?
Currently, version 0.3 of the natural forest map is available on GFW. In the coming months, we will update GFW to version 1, which is now available on the WRI Open Data Portal, Google Earth Engine and GFW Pro. We plan to continue to update the data on GFW as future versions of the SBTN Natural Lands Map become available.
We also plan to release additional analysis capabilities with the data, such as the option to filter deforestation and fire alerts to within natural forests. Stay tuned for future updates!
* Note that the validation points were labeled based on definitions of natural forests from v1 of the SBTN Natural Lands Map, which includes more regional data sets and their corresponding definitions, as well as an additional filtering of local savanna classes to remove vegetation shorter than 5 meters from the forest class. This may affect the validation of the v0.3 natural forest layer because of variation in definitions of natural forest where local data was used. See the v1 technical note change log to see the full list of changes.
** We generally caution against using the SBTN Natural Lands Map to quantify the area of natural lands due to data limitations, including overestimation of natural lands. However, data on natural and non-natural forest cover is much more widely available than other land covers, such as natural grassland and pasture, so we consider the natural forest classes to provide a reasonable approximation of natural forest area. Users should still be aware of the limitations of the data when using it to quantify area.


