PARTNER POST: A Fresh Look at Canada’s Virgin Forests
By Wynet Smith, Ryan Cheng, Peter Potapov and Susan Minnemeyer
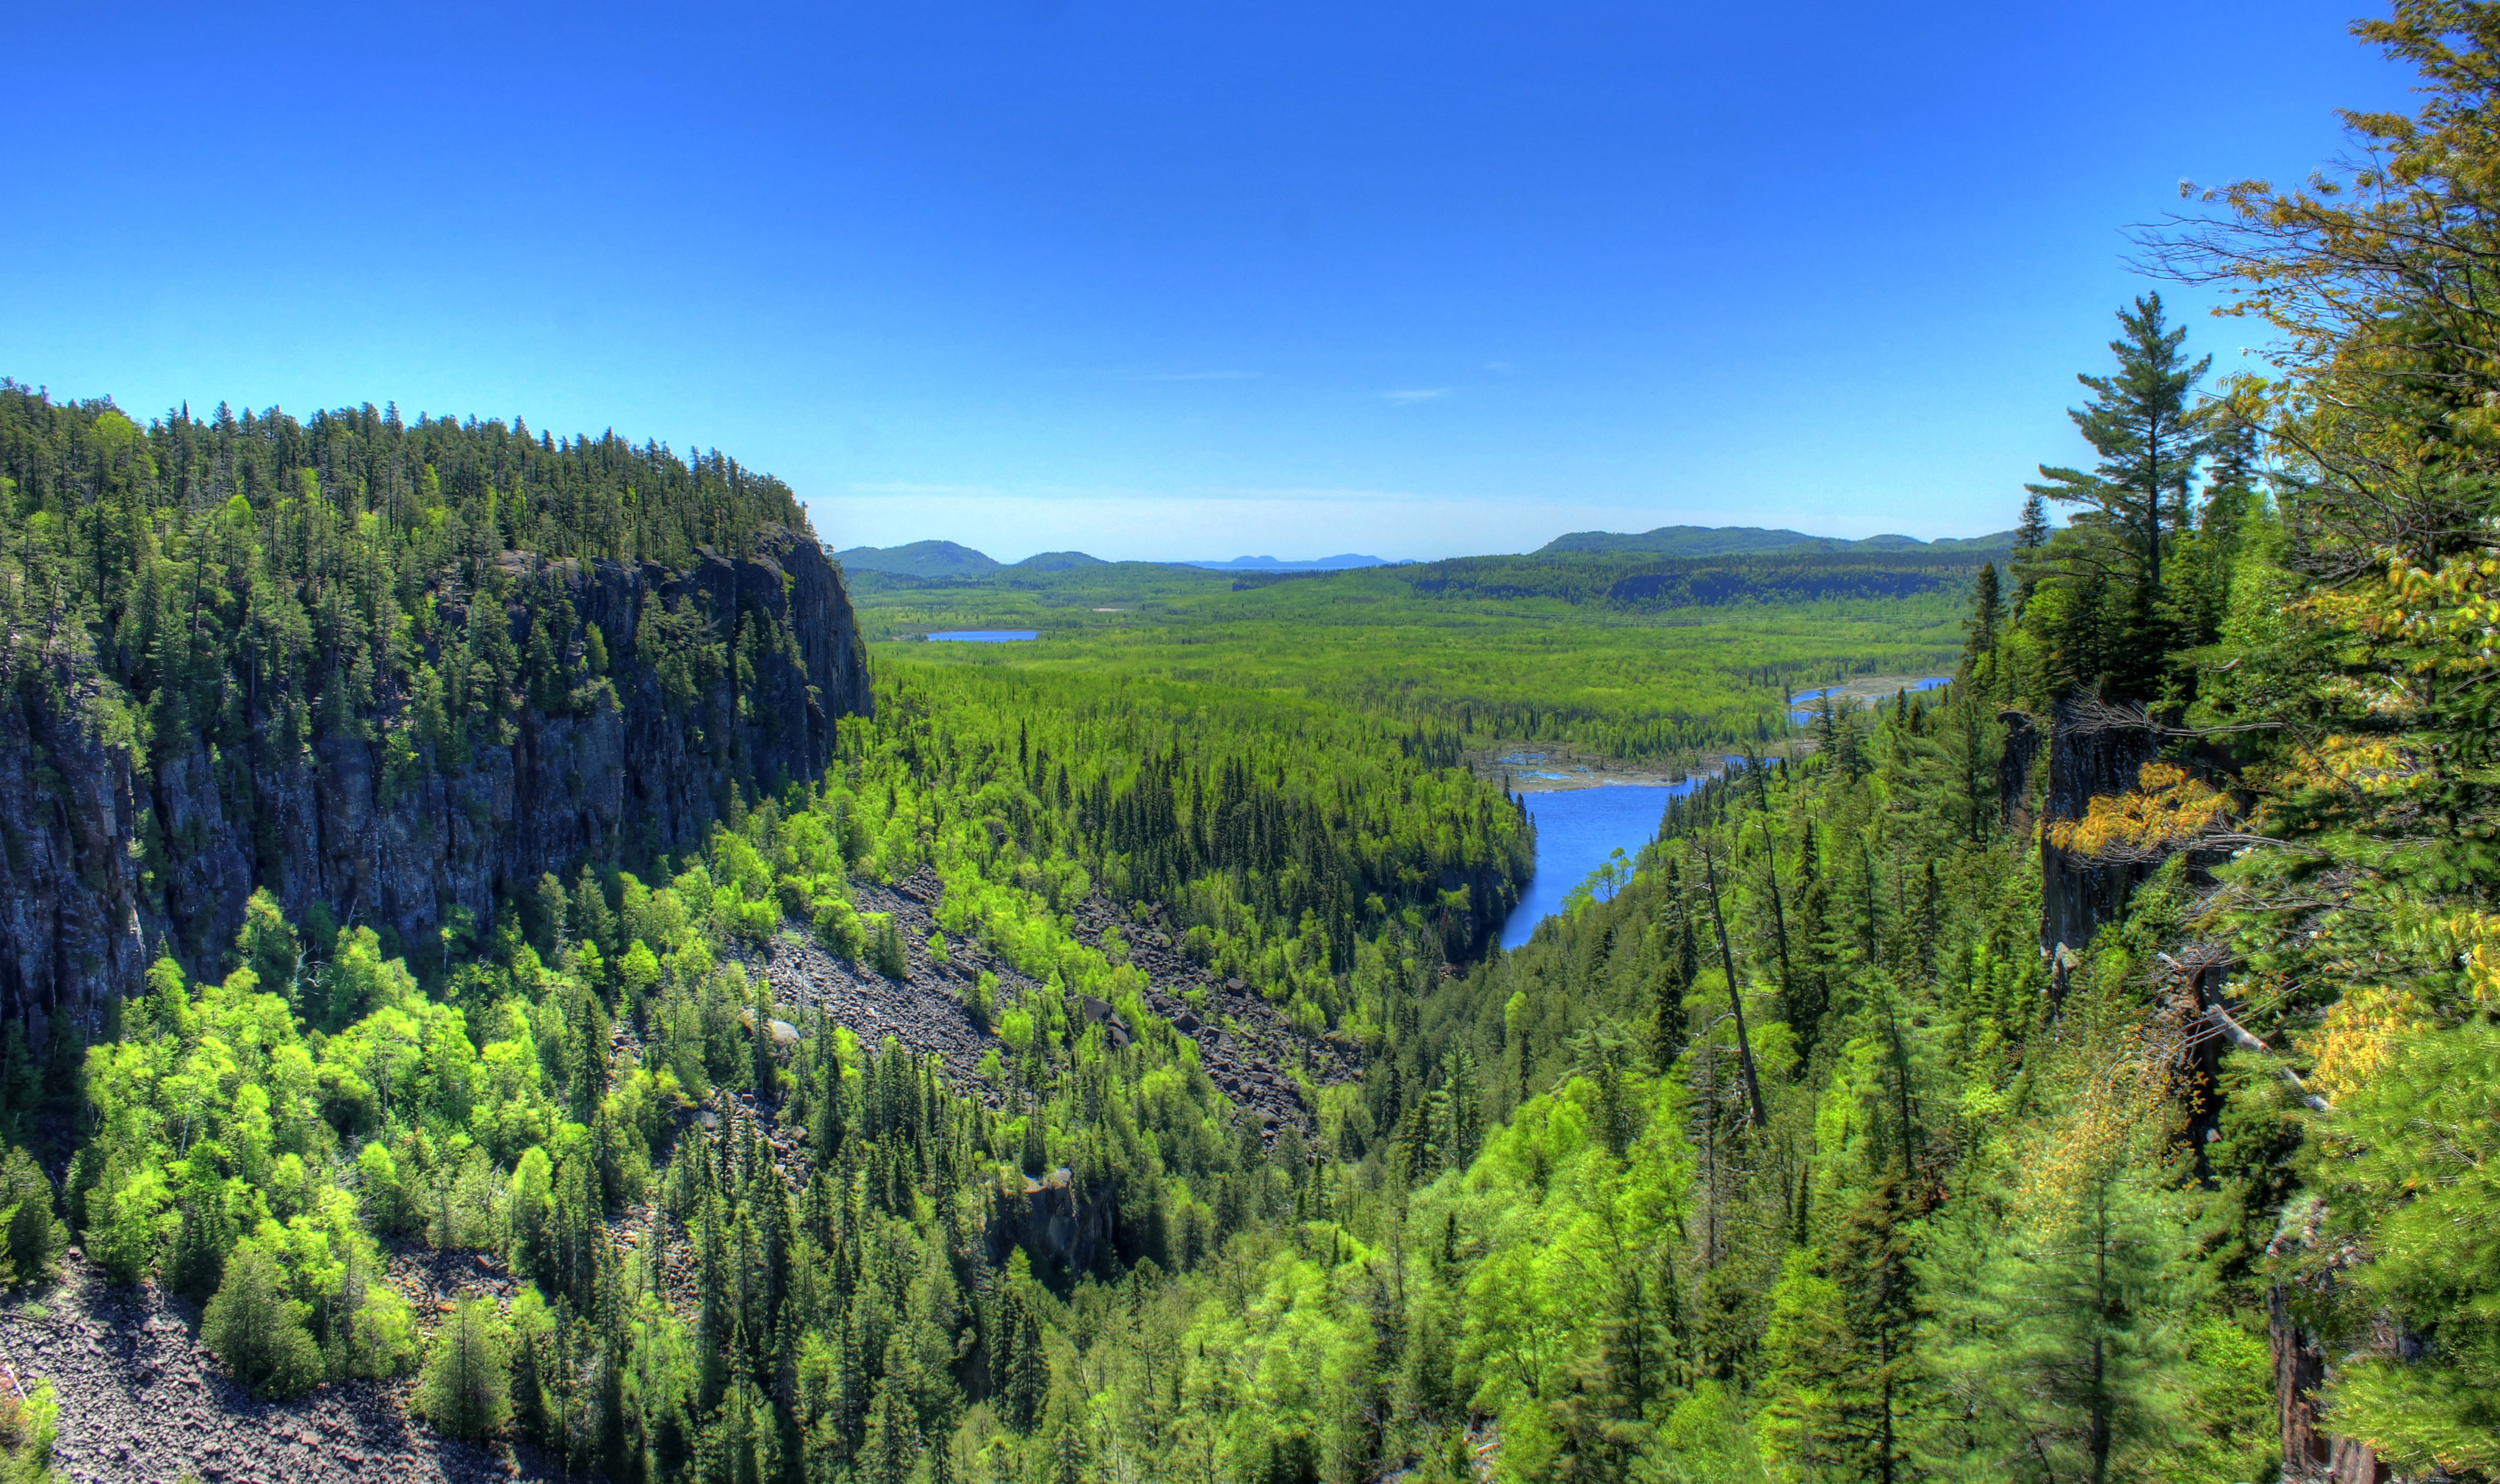 The canyon and forest landscape at Ouimet Canyon Provincial Park, Ontario, Canada. Photo available under the CC0 / Public Domain.
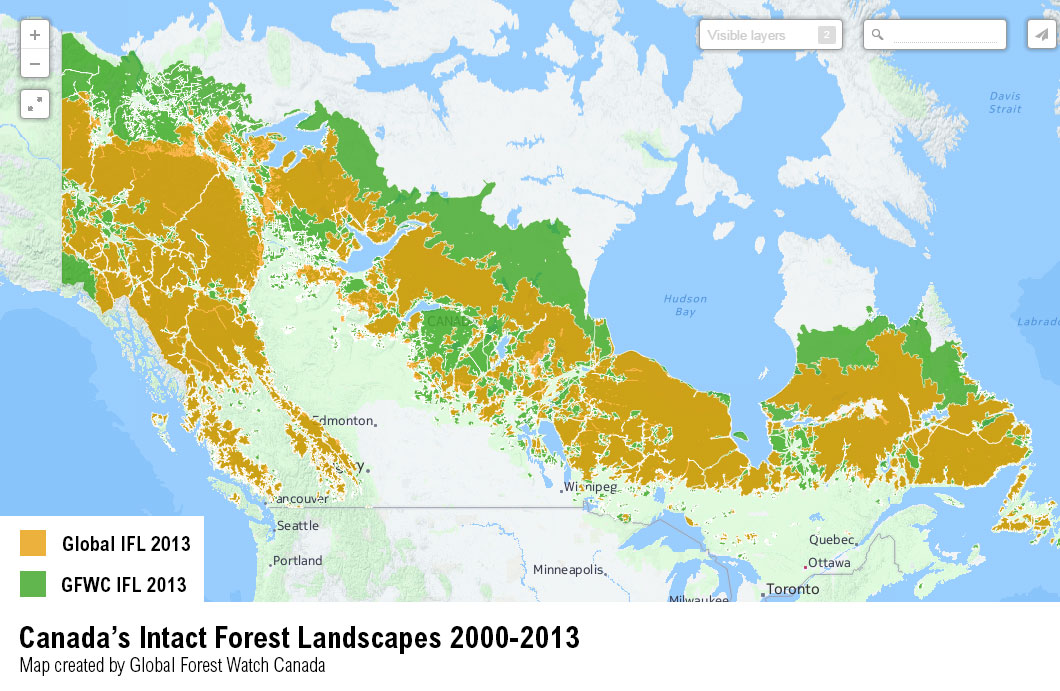
Global Forest Watch Canada (GFWC), an independent Canadian organization that monitors the state of Canada’s forests, just revamped its map of Canada’s remaining Intact Forest Landscapes (IFLs). The new GFWC map is interactive and available here. IFLs are forest ecosystems at least 500 km2 in size that show no signs of significant human activity and are large enough to foster all native species. These environmentally valuable areas provide many benefits in addition to maintaining biodiversity, including carbon storage, water and air purification and protection against storms and erosion. The new maps show how these IFLs changed from 2000 to 2013, providing a fresh look at the current state of Canada’s virgin forests.
Building on a global foundation
Using the best available data from Environment Canada, Natural Resources Canada and NASA’s Landsat satellite imagery, the new Canadian IFL map provides a country-specific dataset that is built upon the global IFL map developed by a partnership of organizations, including World Resources Institute, Greenpeace and Russia’s Transparent World. The Global IFL map was also updated in 2013 to show IFL areas that had been lost to fragmentation, deforestation or other disturbances. Both maps can be seen on the Global Forest Watch platform.
 The map on the left shows IFLs in Canada detected by the global IFL map (in orange). The map on the right shows IFLs in Canada detected by the GFWC map (in green).
The GFWC IFL map and the global IFL map are complementary to one another—in fact, more than 98 percent of the IFLs found on the global map are also on the GFWC map. Differences that do exist are mainly due to changes in mapping methods GFWC made to account for country-specific forest landscape features. The global map uses criteria that are globally consistent and easily replicable so that updates can be made for accurate comparisons over time. GFWC’s map is mostly based on these same criteria with changes in study area, definition of IFL, buffer area and categorization of fires.
| Criteria/Method Element | Global IFL Map | GFW Canada Map |
|---|---|---|
| Study Area | The study area is based on 20 percent tree canopy using a global tree cover data at 500 m resolution. | The initial study area was Canada’s eleven forest ecozones. The 2013 study area was the circa 2000 IFL polygons of 500 km2, which total 4.52 million km2. |
| Technical definition of an IFL | The IFL Mapping Team identify IFLs as 500 km2 in size, with a minimum 10 km internal width, and where all corridors or appendages must be at least 2 km wide. | GFWC identifies IFLs as 500 km2 in size. It does not apply the minimum width of 10 km or the 2 km width corridor requirement for IFLs. Many GFWC IFLs are therefore more irregular. |
| Buffers | Buffering of all infrastructure by 1 km, including navigable waters. | GFWC only buffers highways at 1 km; other features are buffered at 500 m. Navigable waters are not treated as human disturbance and are not buffered. |
| Treatment of fire/burn scars | Fire scars that touch infrastructure are treated as human disturbance and digitized. | Fire scars, even where they touch infrastructure, are not mapped as human disturbance. The fire rule is meant to account for the prevalence of naturally occurring fires in Canadian forests and avoid inaccurately attributing human activity for events that are part of the natural ecosystem. |
Here are some things we learned from the new map about how Canada’s Intact Forest Landscapes have changed in the past 13 years.
New map detects 48 percent more IFLs
The GFWC map detected a total of 4.28 million km2 of IFLs in Canada. That’s 48 percent (1.38 million km2) more than the 2.9 million km2 shown on the global IFL map. Nearly half (48 percent) of these extra IFLs were concentrated across the northern half of the country—mostly within six jurisdictions—and were detected mainly due to the larger northern study area of the GFWC method. These are mainly remote unmanaged forests that are unlikely to be touched by logging, road building or other human activity that impact IFLs in Canada’s southern forest frontier.
| Jurisdiction | Extra IFL (km2) circa 2000 | GFW Canada Map |
|---|---|---|
| Northwest Territories | 383,950 | 26 |
| Quebec | 233,613 | 16 |
| Saskatchewan | 150,361 | 10 |
| Manitoba | 147,969 | 10 |
| Yukon | 118,623 | 8 |
| Nunavut | 102,671 | 7 |
Fire rule reclassifies swaths of degraded forest as IFLs
Approximately 25 percent (353,167 km2) of the extra IFLs resulted from the Canada-specific criteria to treat all fire damage as natural disturbances, rather than human-related, even in cases where they touched infrastructure. This means that areas that were deemed degraded due to what was considered human-caused fires are now reclassified as an IFL. Most forest fires and burned areas in Canada result from natural causes, and most of Canada’s IFLs are in remote areas far from human activity. GFWC’s fire rule therefore avoids attributing human activity for events that are part of the natural ecosystem. This is a key difference between the GFWC map and the global map, which uses a method initially developed in Russia where a significant portion of fires are human-caused. Clear examples of these discrepancies can be seen in the northwest area of Quebec and Saskatchewan.
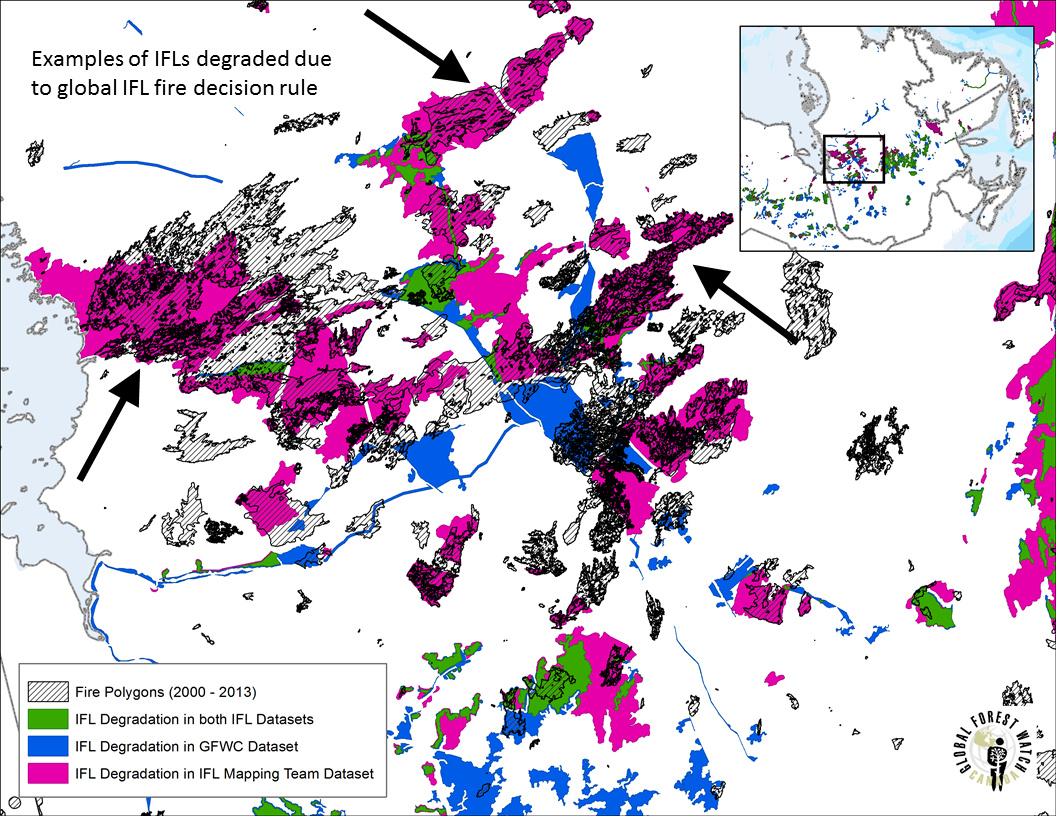 Examples of difference in fire rule for northwest area of Quebec.
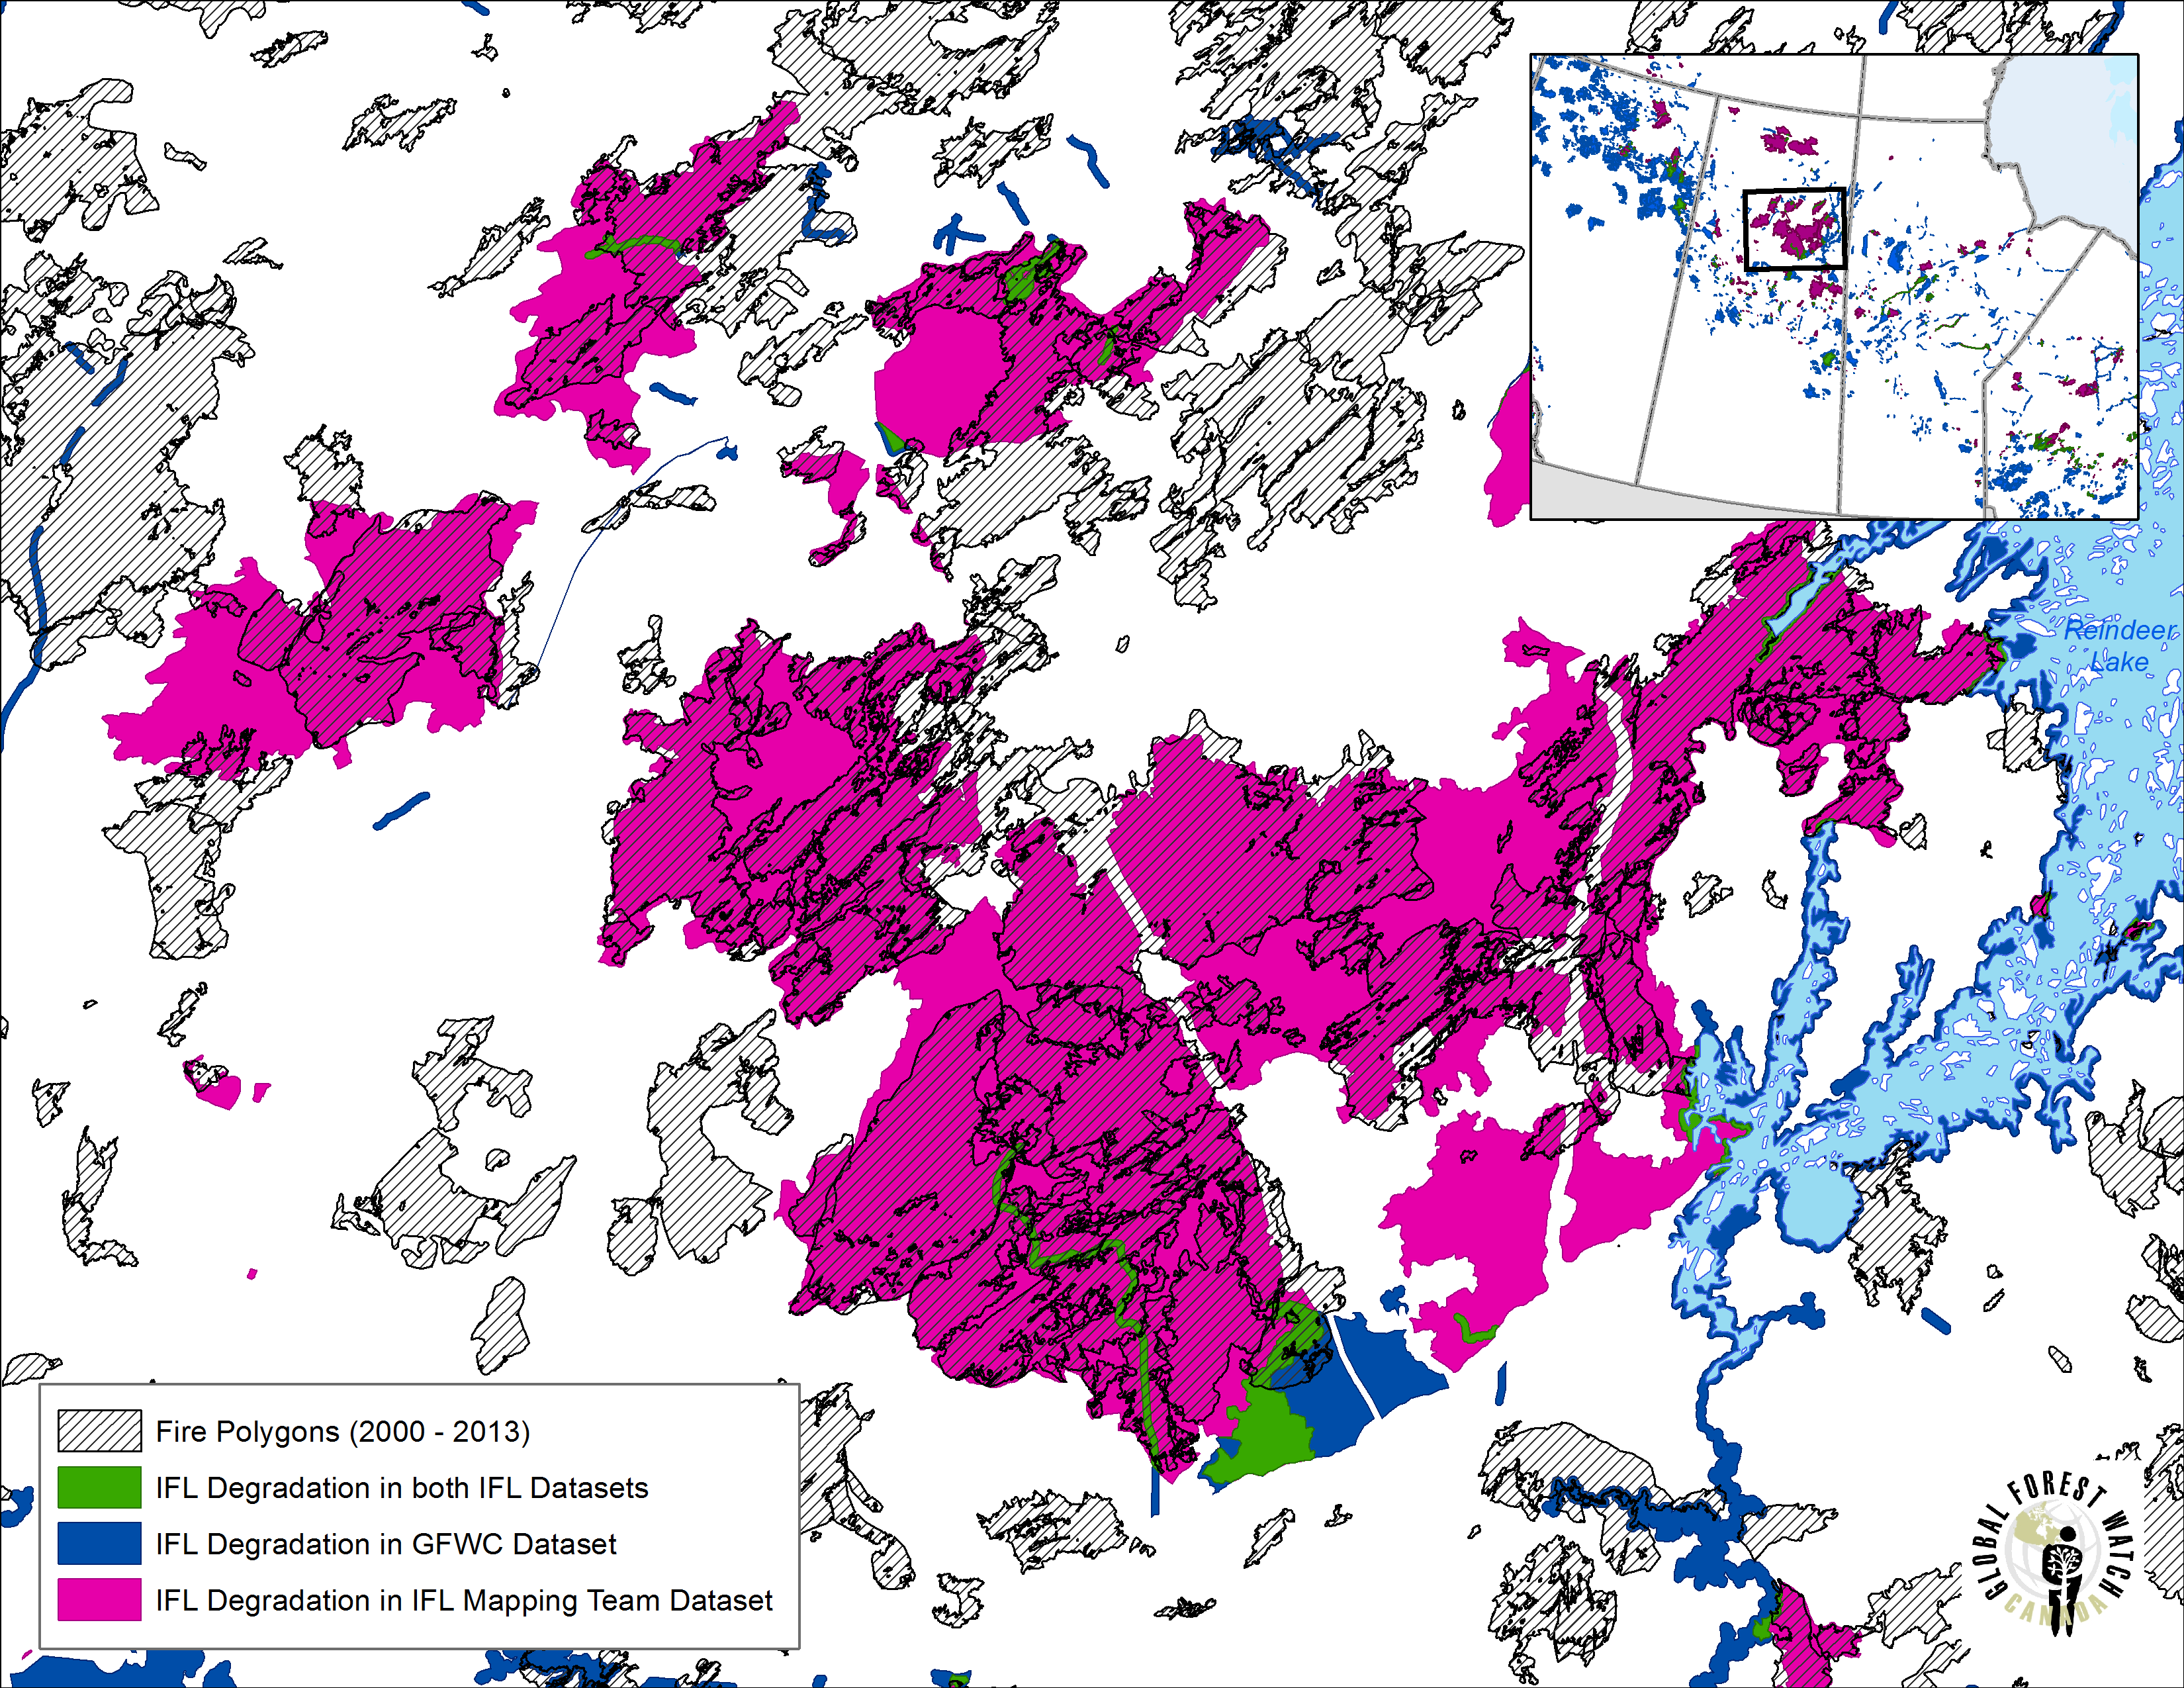 Examples of difference in fire rule for Saskatchewan.
Both maps show 5 percent reduction in IFLs
Notably, despite the differences between the GFWC and global IFL maps, both found that the extent of IFLs decreased 5 percent (due to degradation and fragmentation) between 2000 and 2013. GFWC saw a decrease of 216,199 km2 while the global map saw a 141,888 km2 reduction. Although the drivers of this degradation and fragmentation in Canada may be different than in the rest of the world, it’s clear that IFLs need protection everywhere. Having accurate, up-to-date maps arm policy-makers and forest managers with the information they need to better protect these valuable ecosystems.
Significant Opportunities for Conservation Still Exist
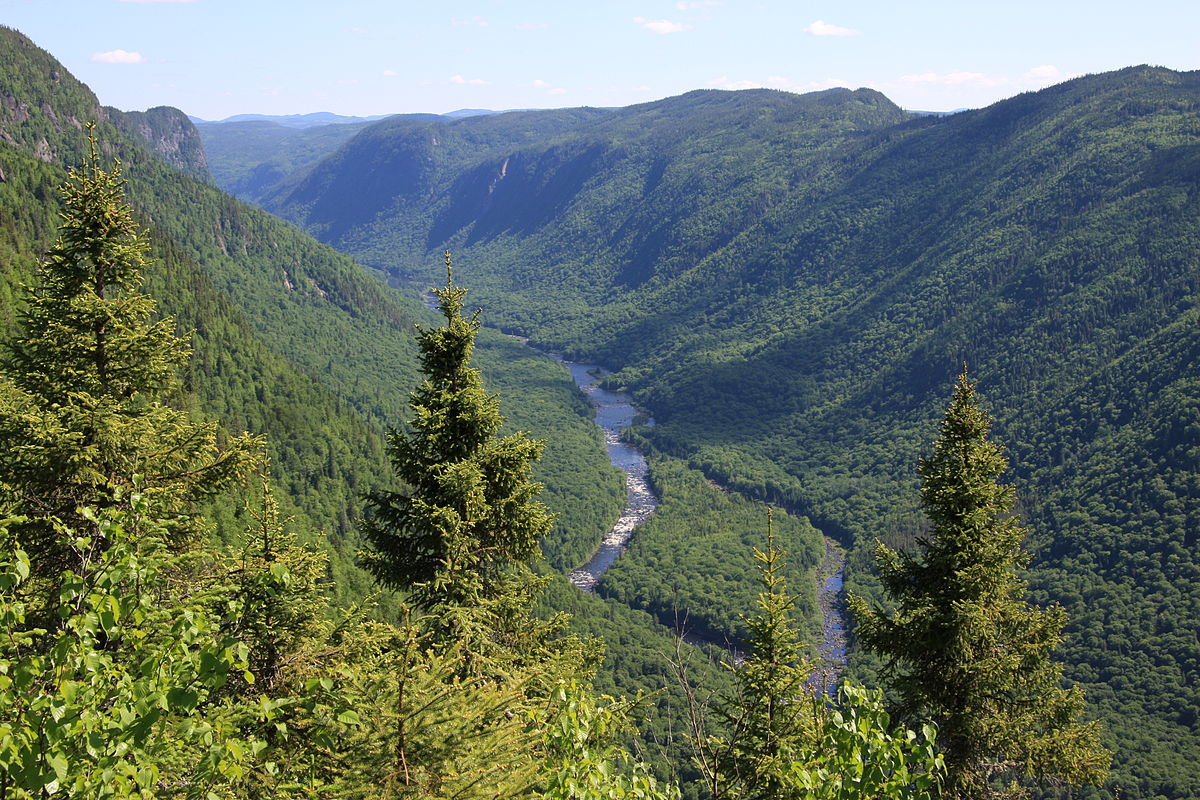 Scenic view of Jacques-Cartier River valley from Andante montain, Jacques-Cartier National Park, Quebec, Canada. By Cephas – Own work, CC BY-SA 3.0, https://commons.wikimedia.org/w/index.php?curid=7117171
Despite some reduction, Canada can still protect 95 percent of its IFLs. Understanding this, decision-makers across the country have already taken promising steps. Since 2009 the Canadian government has designated over 40,000 km2 of new protected areas within Quebec and Ontario, two of the largest provinces. Both have legislation in place to conserve 50 percent of the northern portions of their territories. First Nations in British Columbia, Manitoba, Yukon and the Northwest Territories have established land use plans that call for significant conservation and sustainable management practices on their traditional lands. The updated GFWC and global IFL maps will contribute to these ongoing efforts by providing accurate data that can help track how they affect surrounding forests.
