- Data & Tools
Places to Watch: Curating Data-Driven Stories for Action
Editor’s Note: This post was originally published in December 2017 and later updated in April 2019.
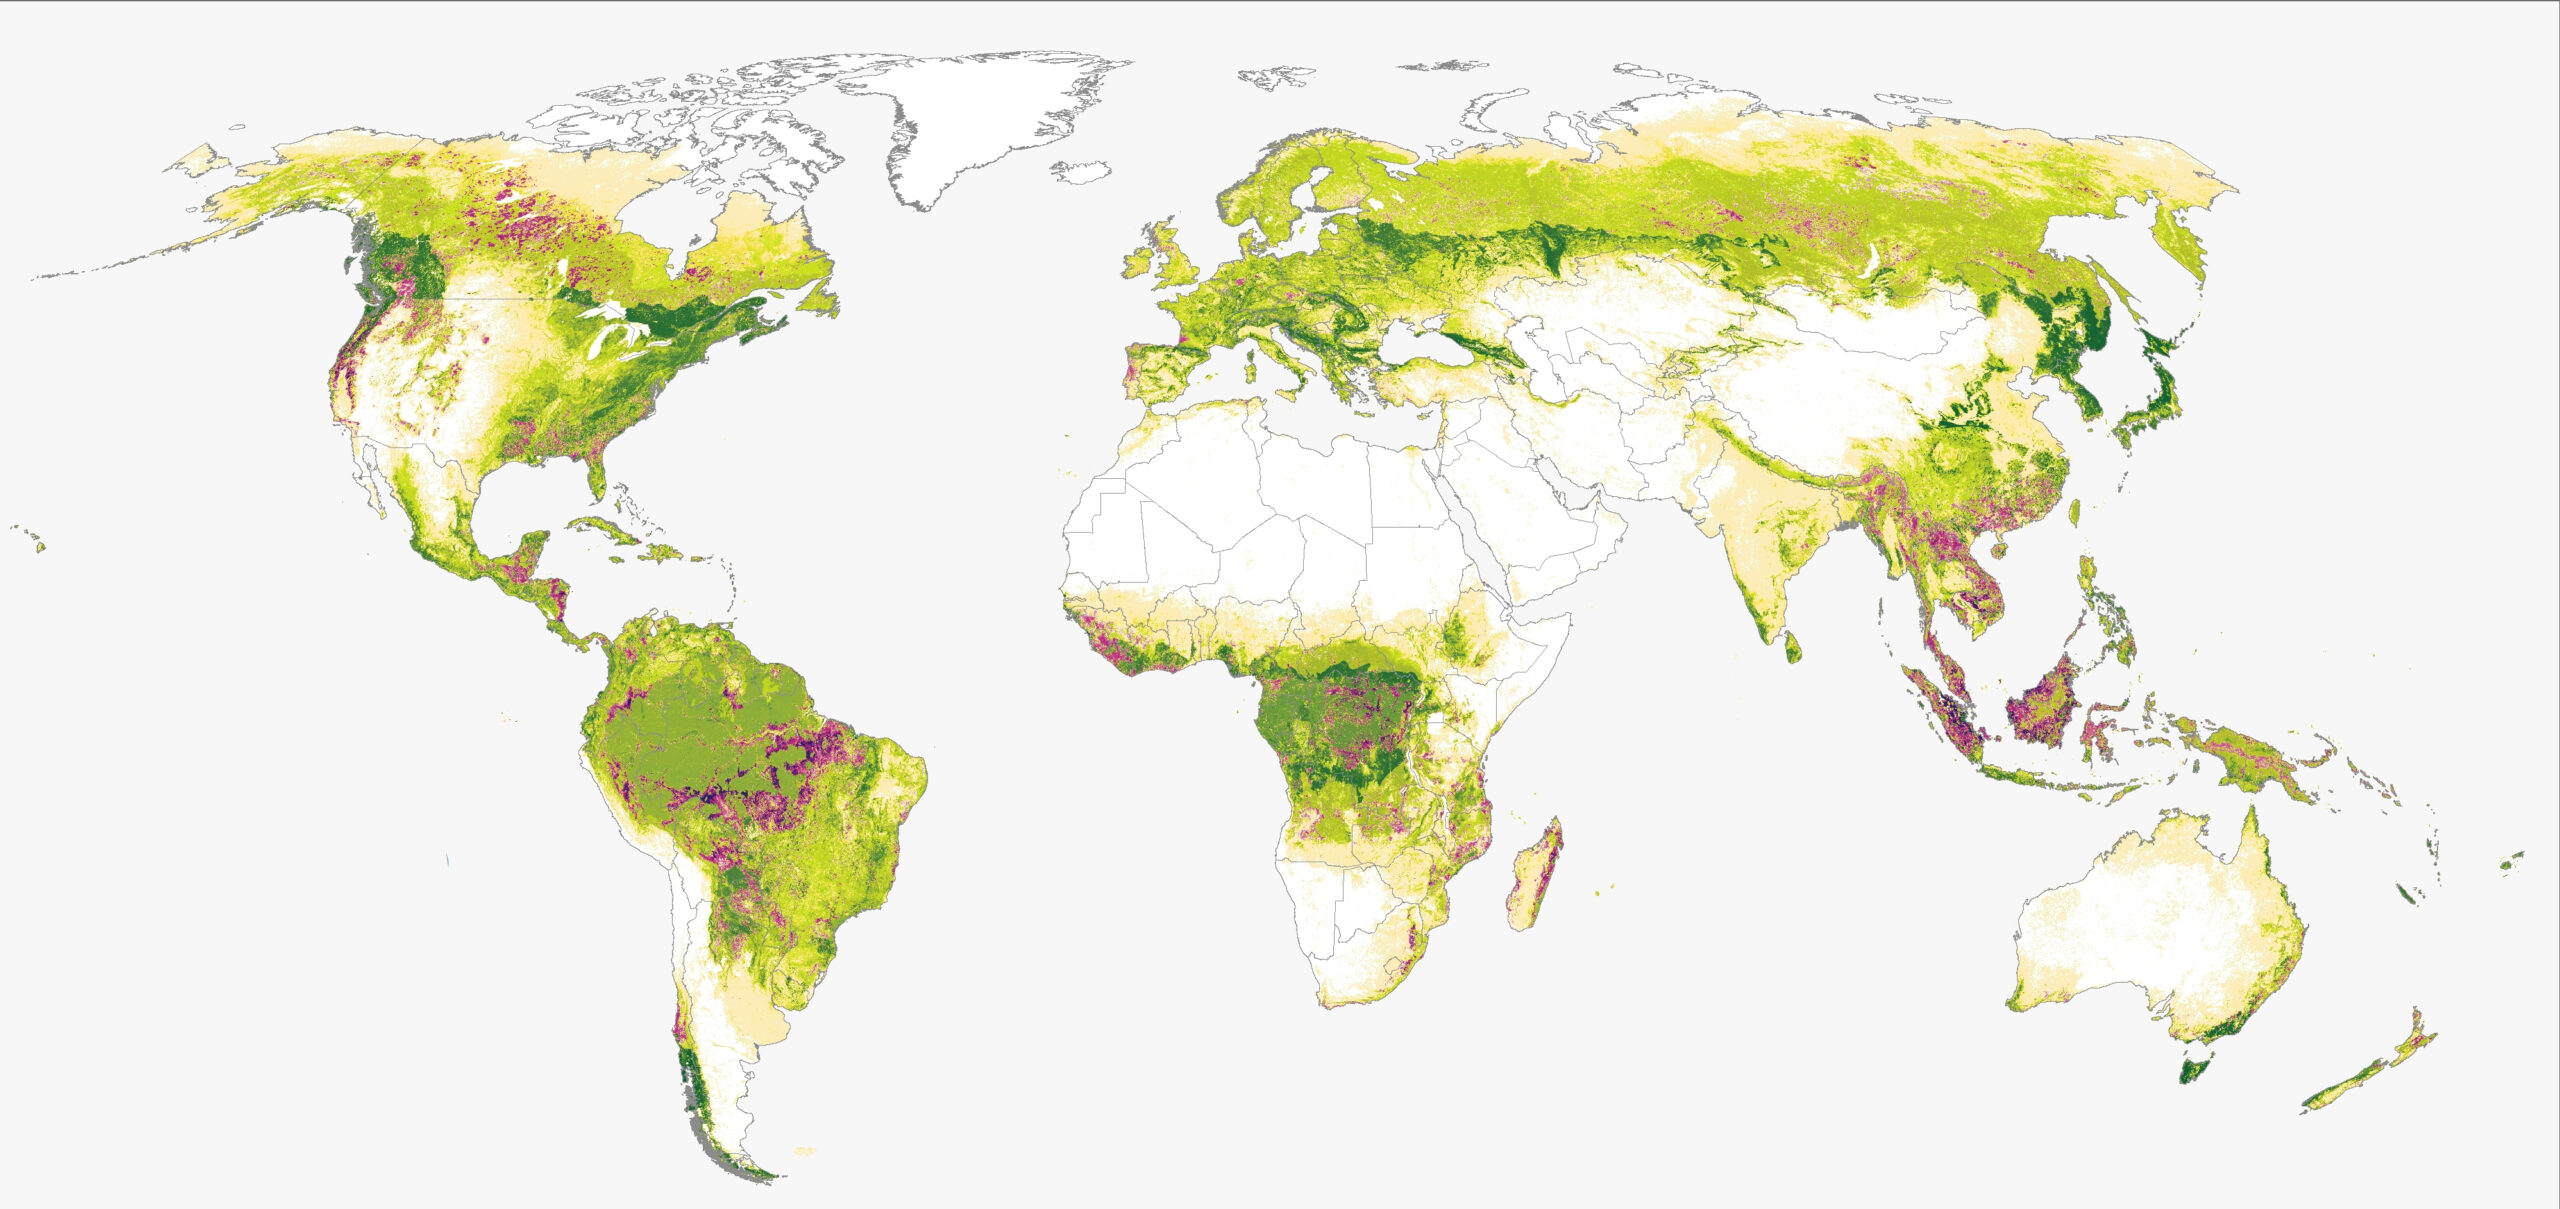
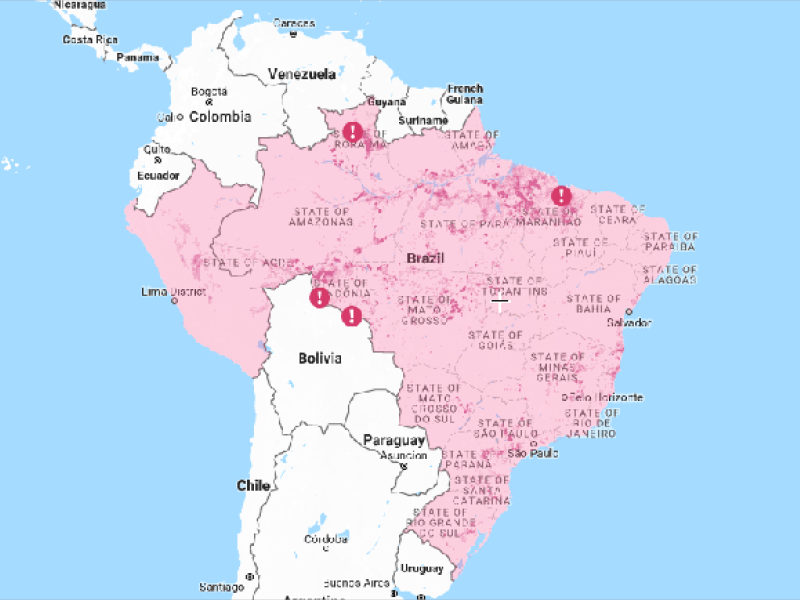
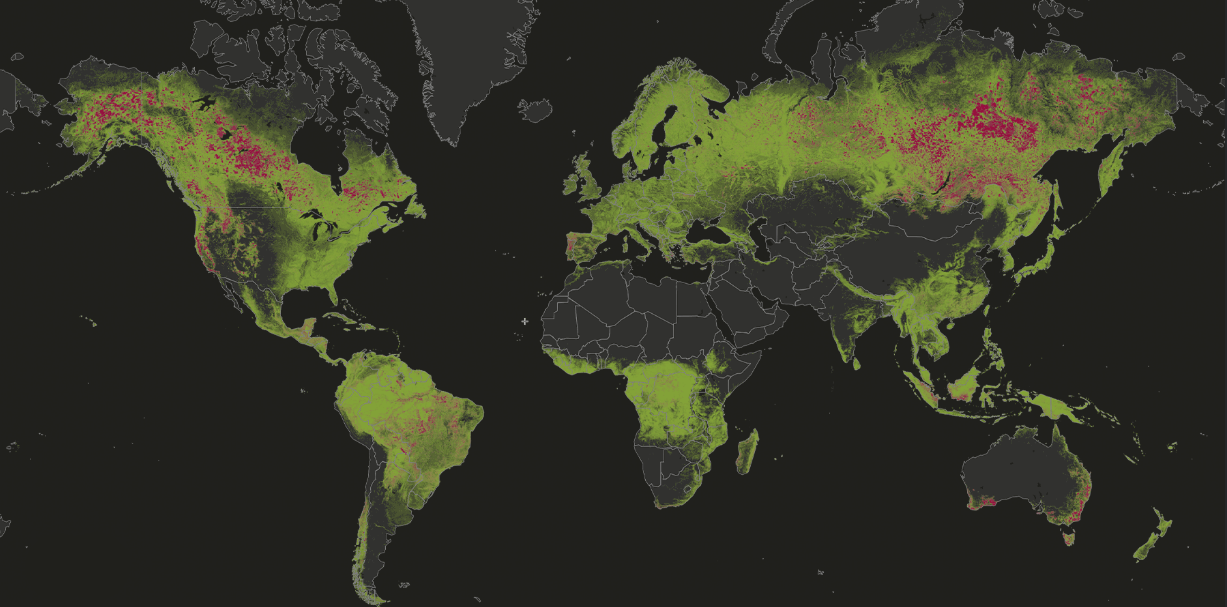
Global Forest Watch’s (GFW) ability to track and display deforestation in near-real-time has changed the way people around the world monitor forests. But for those interested in monitoring large areas like an entire country, region or even the world, the sea of pink deforestation alerts on the map can be difficult to discern. GFW’s Places to Watch initiative aims to solve this problem by filtering, prioritizing and interpreting deforestation data to spotlight areas of recent loss that pose the biggest threat to the world’s remaining forests.
After over a year of piloting and refining this initiative, we’re excited to announce a few changes to the scope of Places to Watch that will start in April of 2019:
- GFW will no longer produce investigations related to these locations. Instead, we will look to our network to collect field intelligence and share these stories with the world. We’re excited to partner with news outlets to continue producing timely, data-driven stories about these locations each month. Mongabay will be a leading contributor to this initiative by assigning journalists from their global reporting network to follow up on alerts and produce original news stories which add insight, character and context to Places to Watch.
- GFW will now generate a list of new Places to Watch locations on a monthly basis. Locations of interest will be distributed through the Places to Watch newsletter and will be available on the GFW map.
- While we will still use the original automated algorithm to identify areas of concern each month, Places to Watch locations will no longer be limited to these locations. We’re experimenting with new algorithms that use criteria beyond Intact Forest Landscapes and protected areas, to identify additional areas of concern due to factors like illegal activity or non-compliance with zero-deforestation commitments. When relevant, we will also include areas of recent forest loss identified manually using GLAD deforestation alerts.
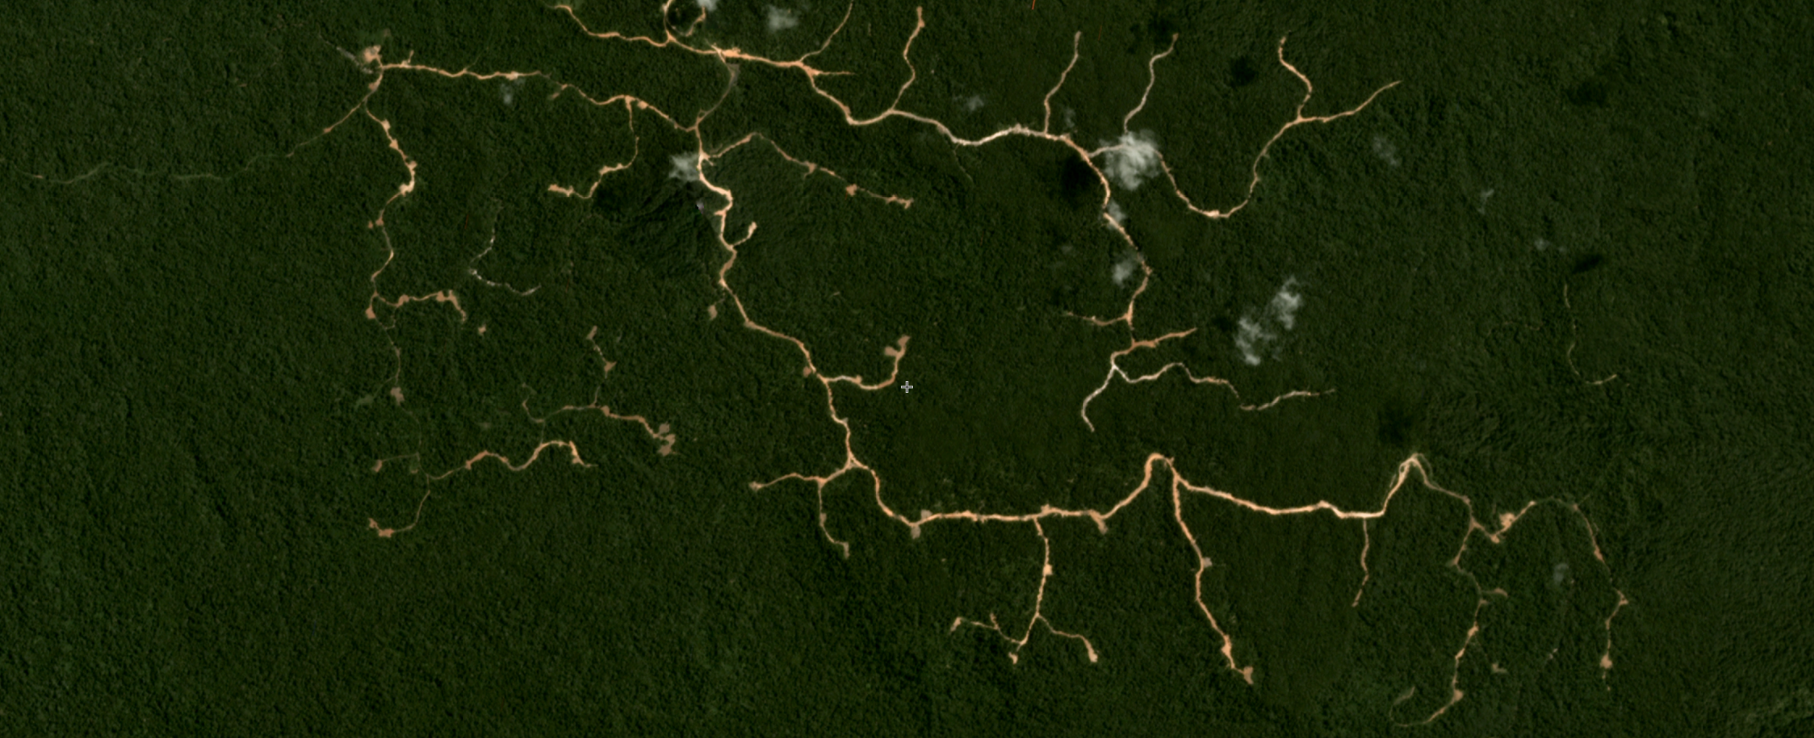
Places to Watch will remain a data-driven storytelling initiative that pairs deforestation alerts with satellite imagery, intel on what is happening on the ground and additional resources to learn more. We’re confident that these modifications will better facilitate turning GFW’s sea of pink pixels into insights that aid engagement and action.
How does Places to Watch work?
Automated Analysis: Most Places to Watch locations begin with an automated analysis, which identifies the concentration of 30-meter resolution GLAD deforestation alerts in areas of intact forests and protected areas. The system uses an automated index to select the top ten places in Central America, South America, tropical Africa, mainland Asia and Southeast Asia. Read our technical note for more information on the ranking methodology.
However, Places to Watch locations are not limited to areas detected using this automated criterion. When available, we will also include areas of recent forest loss identified manually using GLAD deforestation alerts.
Human Curation and Investigation: GFW experts review all computer-generated places to determine the areas of greatest concern based on evaluation of satellite imagery, contextual information and their own expert knowledge. The GFW team then shares these locations with the world and calls on our network to collect further information about what’s taking place in these locations. When relevant, we’ll share these stories produced by our network in the Places to Watch newsletter.
Places to Watch FAQs
- What regions are included in the Places to Watch system?
Places to Watch currently covers the entire pantropic region, between the latitudes 30 degrees north to 30 degrees south
- How can I learn more about the methodology used for Places to Watch?
Read “Places to Watch: Identifying High-Priority Forest Disturbance from Near–Real Time Satellite Data” for more detail on the methodology used for Places to Watch.
- Why aren’t there many alerts within a specific Place to Watch on the map?
We look at the number of alerts in an area within a 30-day window so that we can highlight areas of recent change. However, this also means that areas may be identified that have had relatively little change beyond the past month. We curate each place to bring you what we think are the most noteworthy stories of recent change. We will always clearly indicate the date range used in the analysis.
- I have more information about what’s happening in a Place to Watch. What should I do?
If you have additional information to share about a place to watch, please email PlacesToWatch@wri.org to let us know! We are always happy to share these details with relevant contacts in our action network. You can also post a user story straight to Global Forest Watch to share your knowledge directly with all of our users. As always, we encourage you to share Places to Watch on social media using the hashtag #PlacestoWatch.
- How can I stay updated on Places to Watch?
Sign up here to receive each Places to Watch curation in your email each month. Places to Watch are also updated on GFW map. If you’re a journalist interested in covering future Places to Watch, please email GFWMedia@wri.org. Our team is equipped to provide additional analysis and resources upon request.
Explore More Articles
Jul 23, 2024|Data & Tools|6 minutes
Looking for the Quickest Signal of Deforestation? Turn to GFW’s Integrated Alerts
GFW’s integrated deforestation alerts layer combines the analytical power of GLAD, GLAD-S2 and RADD deforestation alerts to provide a faster, more confident view of forest disturbances than any one individual system.