Caveats to the 2016 Tree Cover Loss Data, Explained
Forest in Minas Gerais, Brazil. Flickr/João André O. Dias
New data on global tree cover loss shows that Brazil experienced a major spike in tree cover loss in 2016. Below we explain several caveats and nuances related to the University of Maryland tree cover loss data set that are important to understand the significance of this finding.
Tree Cover Loss Does Not Always Equal Deforestation
The University of Maryland’s GLAD annual tree cover loss data set measures the removal of at least half of tree cover within a 30-meter pixel (also known as stand replacement disturbance). When a pixel registers as loss, it may include the complete mortality and removal of trees, as well as areas of fire degradation that may eventually recover. While fires were likely the major cause of the 2016 spike in tree cover loss, we don’t yet know how many of the trees actually died and how many will recover in the coming years. In the Brazilian Amazon, the first time a fire occurs, it can cause the loss of 42-57 percent of biomass, and kill between 10-50 percent of all trees. Once a fire occurs, it is more likely to happen again and with more intensity that will likely kill any remaining trees. Sentinel satellite imagery confirms that some of the 2016 loss began to recover in 2017, at least in the canopy. However, it takes 4-7 years for forests to regenerate to a similar pre-fire state, and fire impacts can still be detected through LiDAR for at least ten years after a fire. The University of Maryland is working on an annualized tree cover gain data set, which will help us determine whether these scorched forests will recover.

Brazil Loss May Be an Unprecedented Event, or Part of a Pattern
The 2016 spike of tree cover loss in Brazil may or may not be unprecedented across the 16 years of loss data. Fires were also prevalent in 2005, 2007 and 2010 in Brazil; however, the algorithm used to detect tree cover loss during this time was not as sensitive to forest degradation. Currently there are two versions of the algorithm used to create the tree cover loss dataset: one covering 2001-2010, and the other 2011-2016. For this reason, we advise against comparing loss numbers from these two time periods. The University of Maryland is planning to reprocess all previous years of the tree cover loss data using one algorithm, but until this happens, we cannot know for sure how dramatic the 2016 spike is compared to previous fire prone years.
Not All 2016 Loss Occurred in 2016
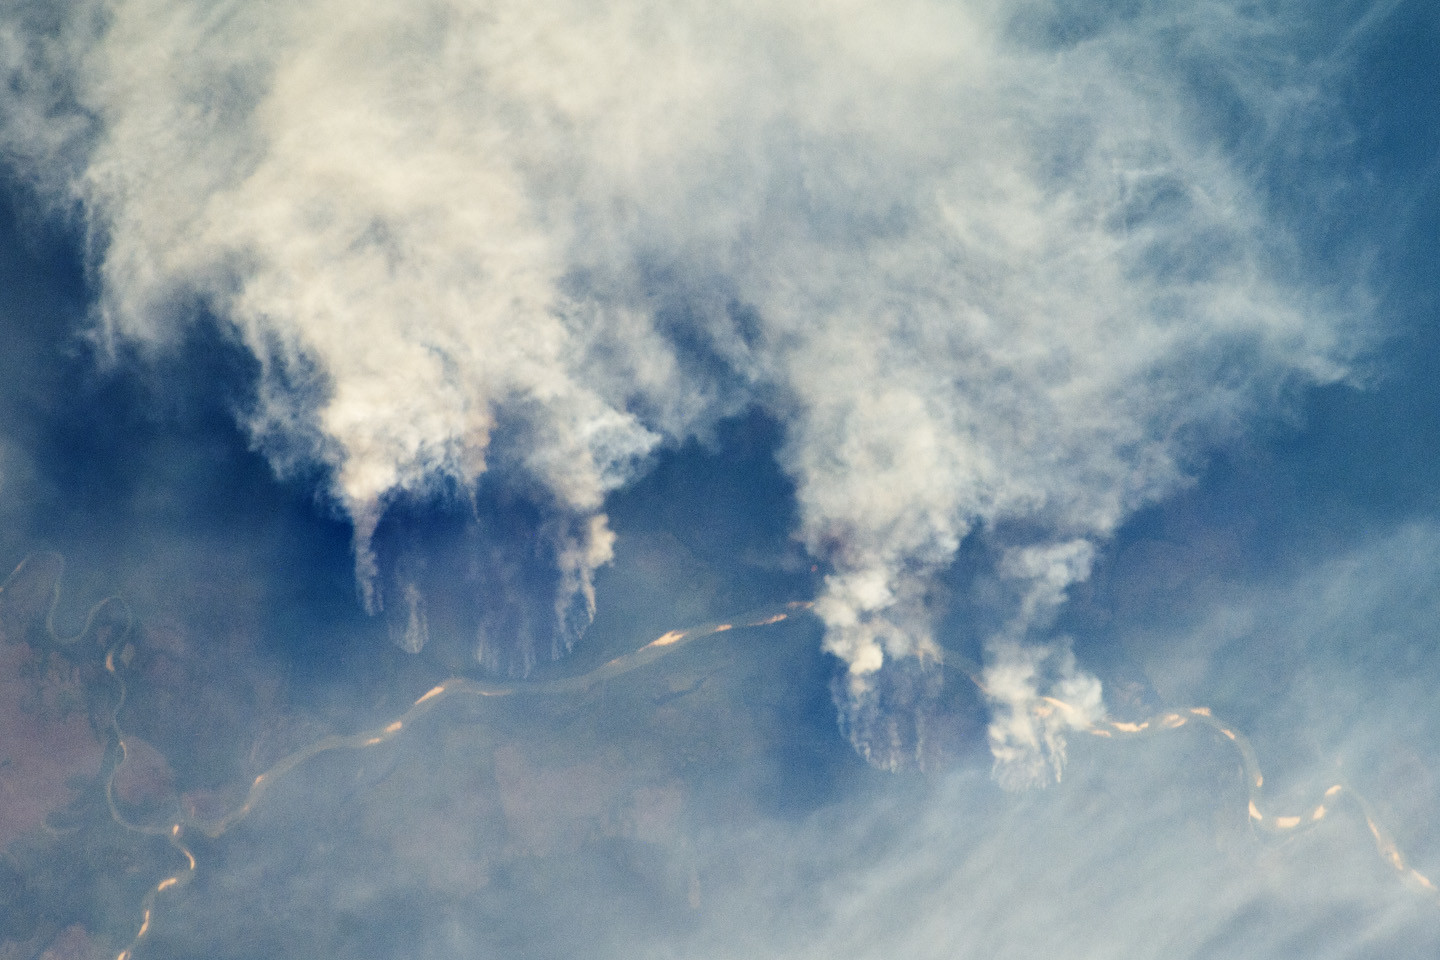
Capturing tree cover loss in the humid tropics with optical satellite data can be a challenge, as cloud cover can obscure the satellite’s view and mask changes in the forest. Image 2 in the Maranhão example above shows how difficult it can be to capture a clear image. El Niño occurred in late 2015 and 2016, exacerbating fires in both years. It is likely that some late 2015 fires and subsequent tree cover loss was first picked up in 2016 due to persistent cloud cover in late 2015 (a common occurrence in Indonesia as well, where cloud cover is prevalent). This can happen across any two years of the tree cover loss dataset, which is why we recommend using a three-year moving average to assess totals and trends in the tree cover loss data.
We Don’t Fully Understand the Role of Fires in Tree Cover Loss
We know that the 2016 tree cover loss in Brazil occurred largely due to fires, but it is difficult to quantify how much loss was caused by fire and how much was caused by other regional drivers, such as large and small scale agriculture and logging. It is also difficult to tell how many fires were natural or human-caused. Some fires were remote and possibly caused by lightning, but even remote fires can be caused by small-scale subsistence activity by indigenous populations. On the other hand, many fires appear close to agriculture, roads, and settlements and are likely human-caused. Finally, El Niño, climate change, and land use practices all increased the risk of fires, but it is impossible to know how much each individually contributed. A global, remote sensing based dataset can consistently detect changes in the tree canopy cover, but not the underlying drivers of those changes. We are working with the University of Maryland to better understand how fires contributed to the 2016 tree cover loss.

Fire Counts May Not Mirror Tree Cover Loss
Counts of fire alerts in Brazil do not necessarily mirror the large spike in tree cover loss. This could be due to the nature of the forest understory fires in the Amazon, which are largely slow-moving, low-intensity fires that are not consistently detected by the MODIS and VIIRs sensors. Despite their short height, the slow-moving nature of these understory fires causes damage to trees from sustained heat, resulting in loss of tree canopy and possibly tree mortality.
The Tree Cover Loss Tells a Different Story Than Official Estimates
Last week, the official Brazilian government system, PRODES, reported a decrease in deforestation in the Amazon in August 2016 – July 2017. To make sense of the PRODES data vis-a-vis the University of Maryland data, one must first understand that the two systems measure different scopes of forest change with differing methodologies. PRODES captures new, clear-cut deforestation of primary forest in areas larger than 6.25 hectares, meaning that once deforestation occurs, the area is excluded from future monitoring by PRODES even if the forest regrows. The University of Maryland dataset captures a wider spectrum of tree cover loss, including loss in secondary forest, forest degradation from fire, and loss in areas as small as 0.1 hectares. PRODES also uses a different twelve-month period (August to July, while the University of Maryland system uses a calendar year).
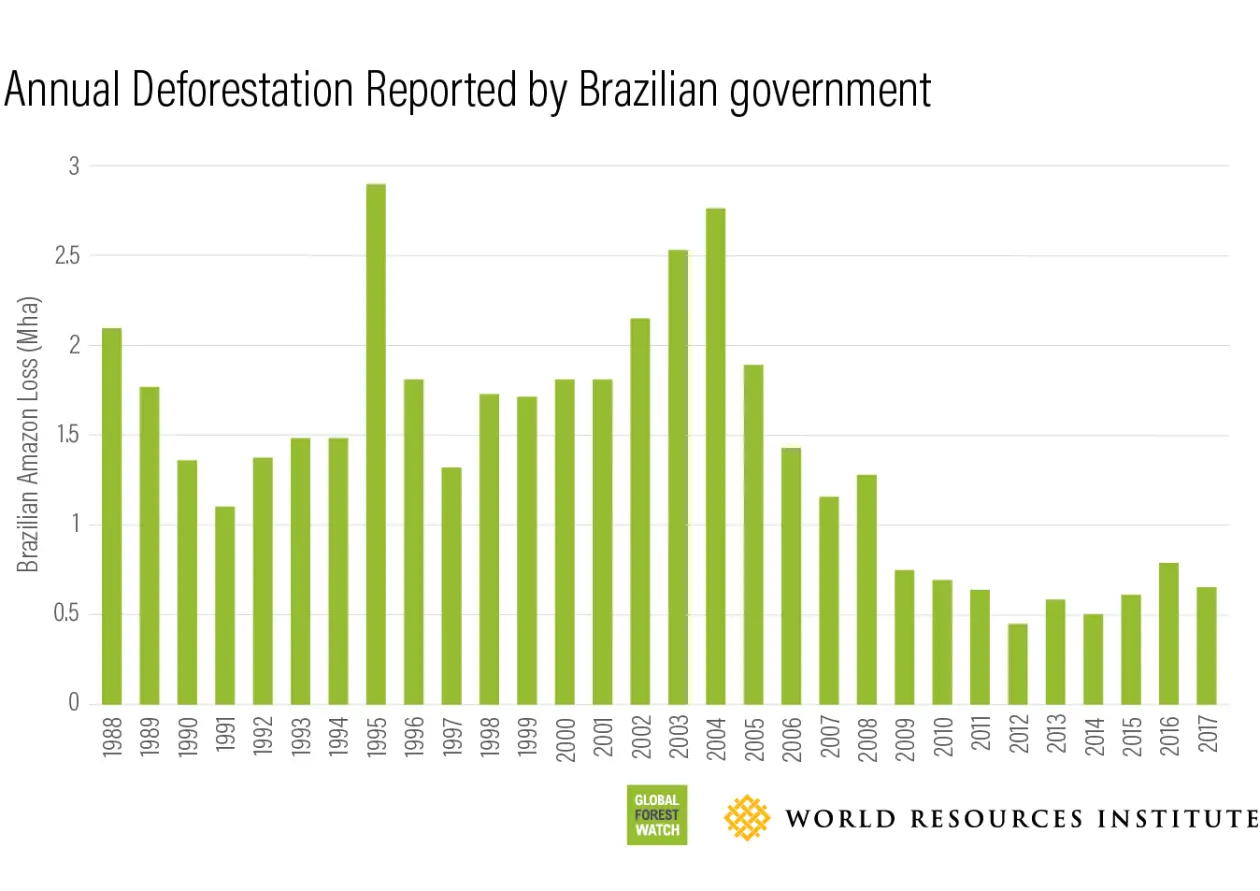
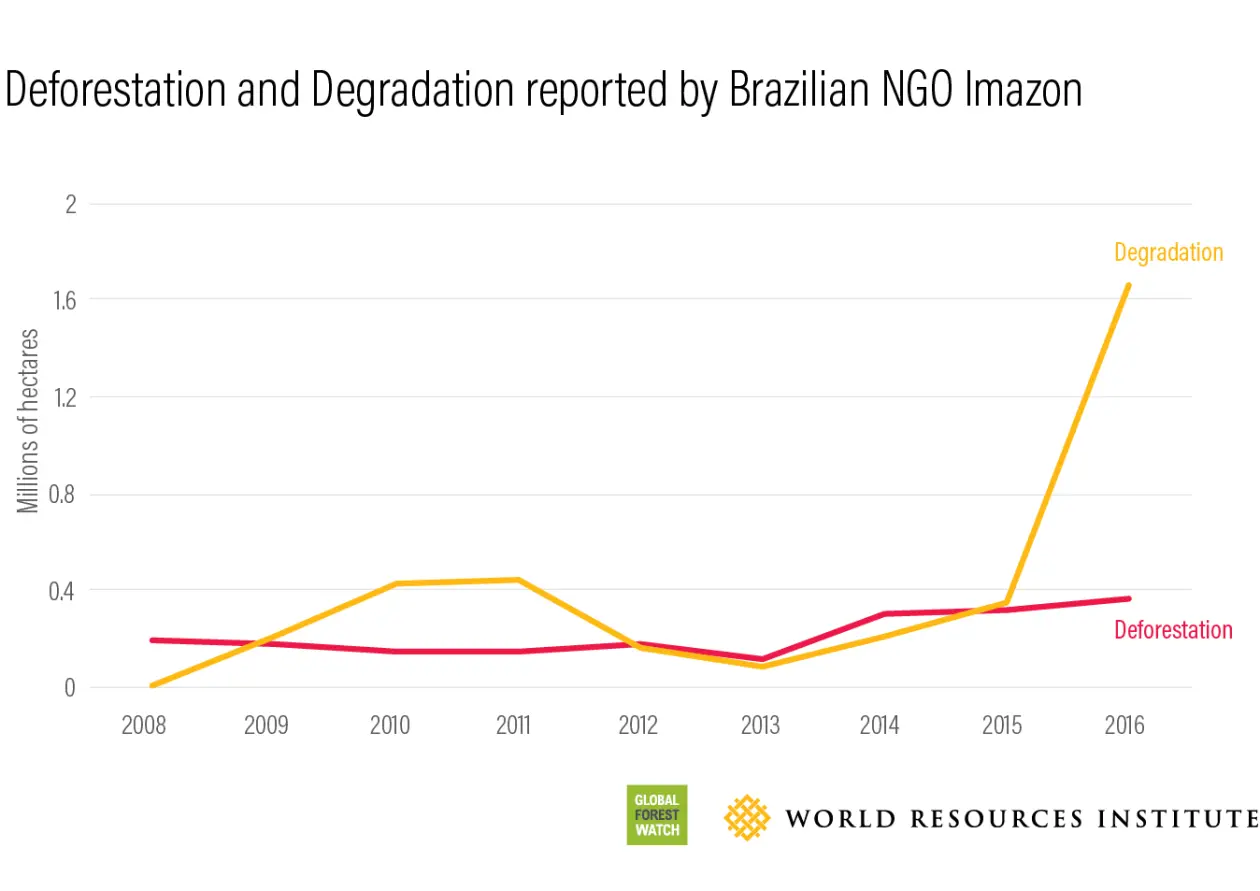
The reduction of large-scale conversion of primary forest in the Amazon reported by PRODES is positive news. At the same time, the University of Maryland data show that other forms of forest disturbance reached new highs in 2016 (a trend confirmed by independent SAD degradation alerts from Imazon). These forms of disturbance including degradation due to fires are also important to measure because of their effects on carbon storage, biodiversity, soil, water, and people’s livelihoods.
