Tracking Wildfire Trends as Fire Seasons Heat Up
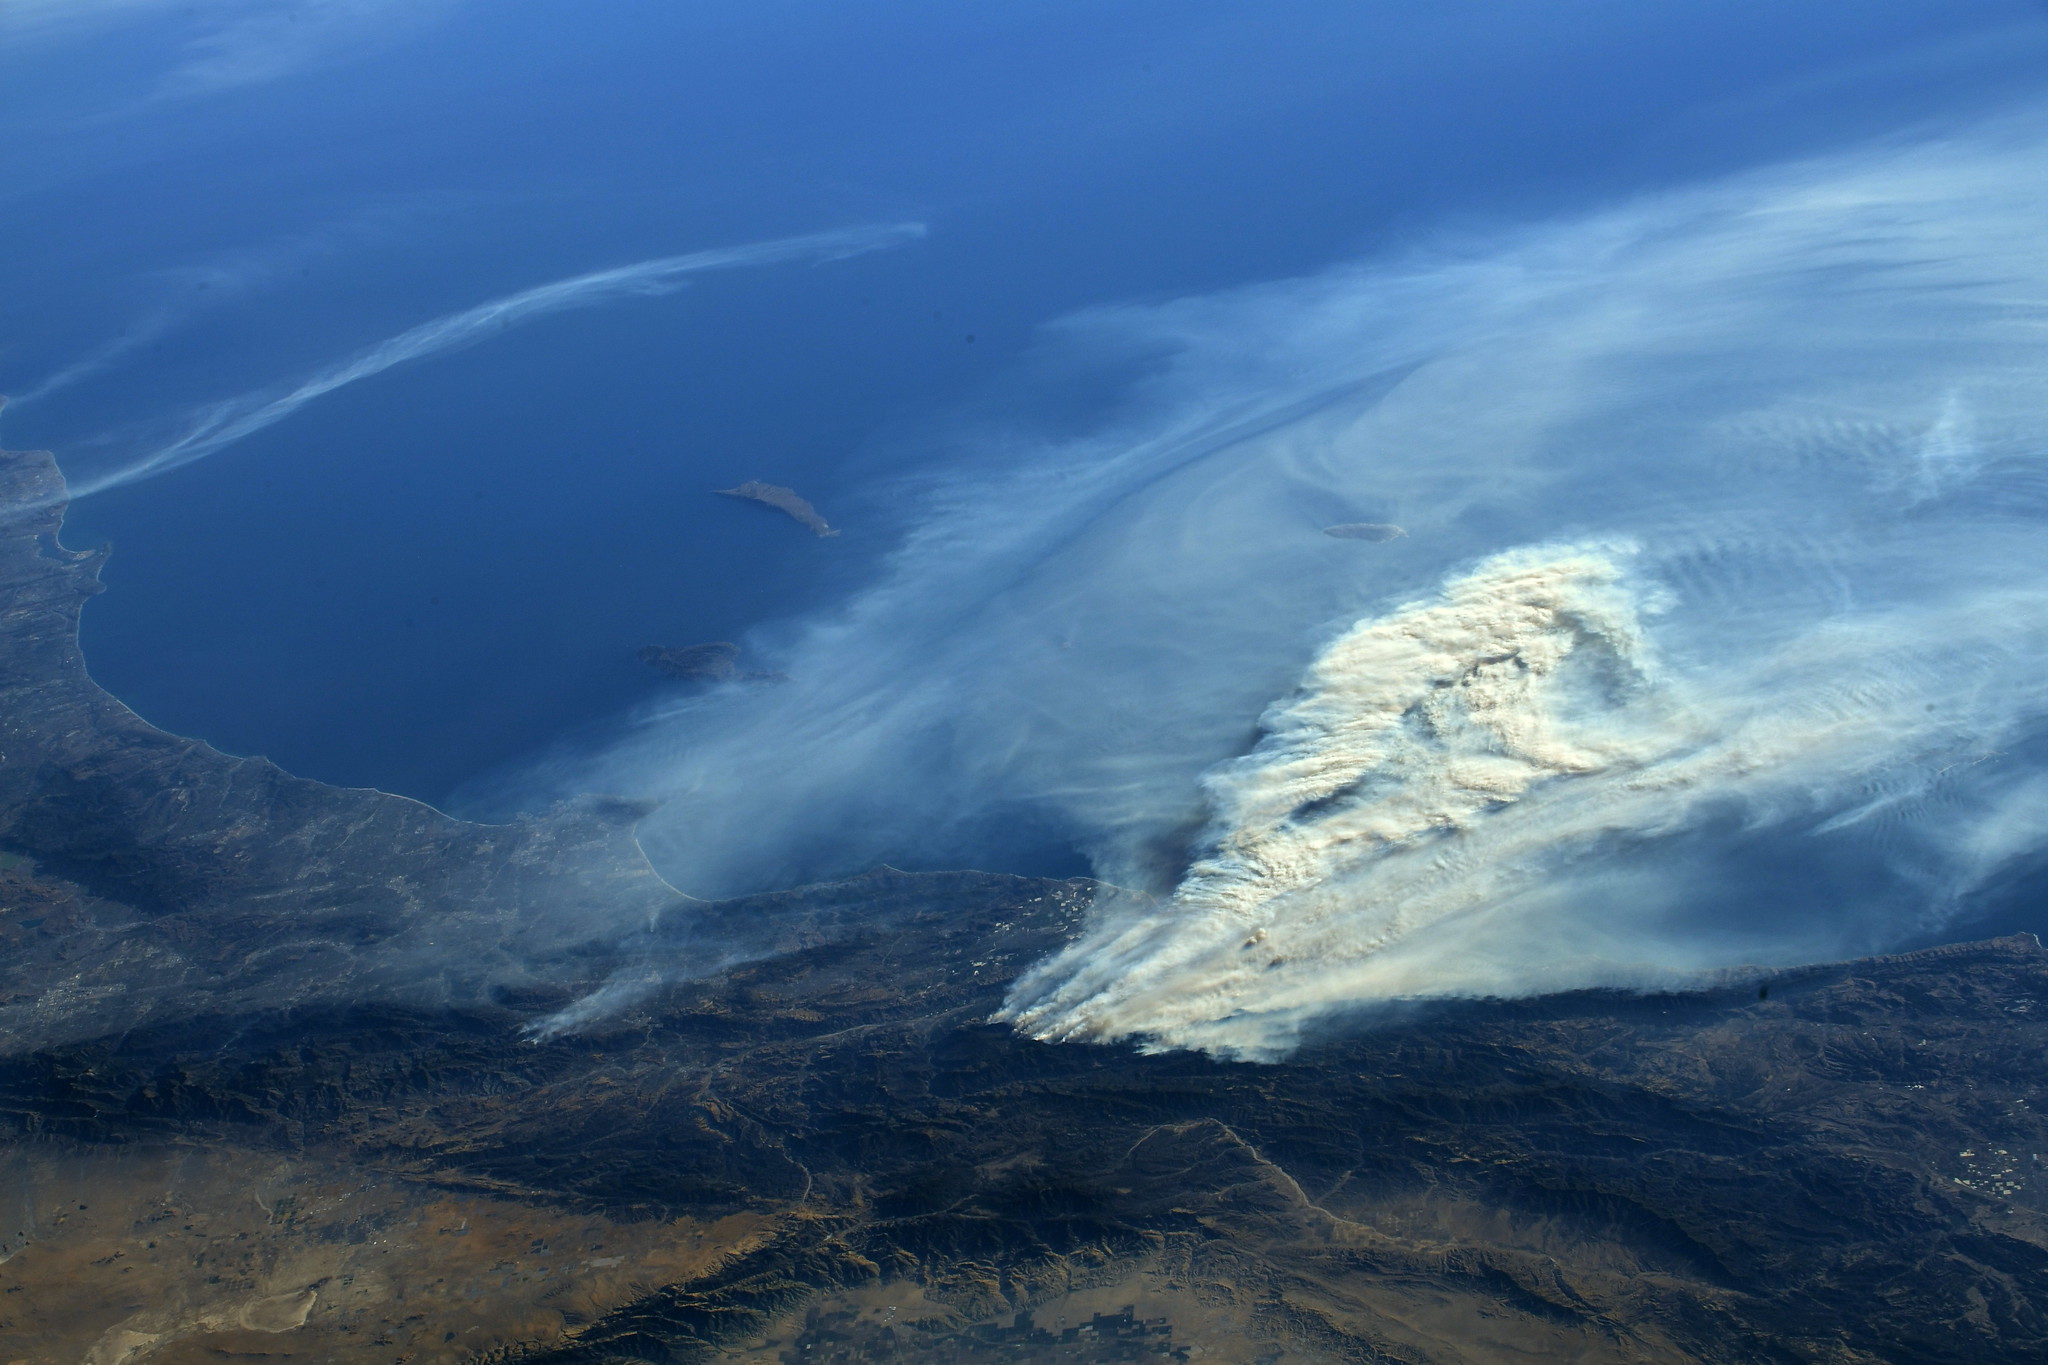
Fires in Southern California as seen from the International Space Station. Courtesy photo / NASA Johnson.
Smoke and haze should never be mixed with a respiratory disease, but as we enter the 2020 dry season, the ongoing coronavirus pandemic threatens to overlap with a potentially intense fire season— adding pressure on emergency response systems already stretched thin.
Monitoring fires and tracking fire trends will be more important than ever this year. NASA’s daily fires alerts, derived from satellite data, are now available on the Global Forest Watch (GFW) dashboards, making it easy to track active fires, compare fire seasons across the last two decades and assess their impact on forests and protected lands around the world.
Here are four questions the fires data on GFW can help answer:
Where are fires burning?
GFW allows users to pinpoint where fires are actively burning. Fire alerts from the past three months are displayed on the GFW map in clusters, with darker reds indicating a higher concentration of alerts.
Users can select any 3-month date range extending back to 2012 to view specific historical fires as well. The Australian wildfires from the end of 2019, for example, have a distinct signature in the data.
The GFW dashboard can also provide analysis of where the most significant number of fires have been burning over the past four weeks, allowing users to quickly focus on the areas of highest concern.
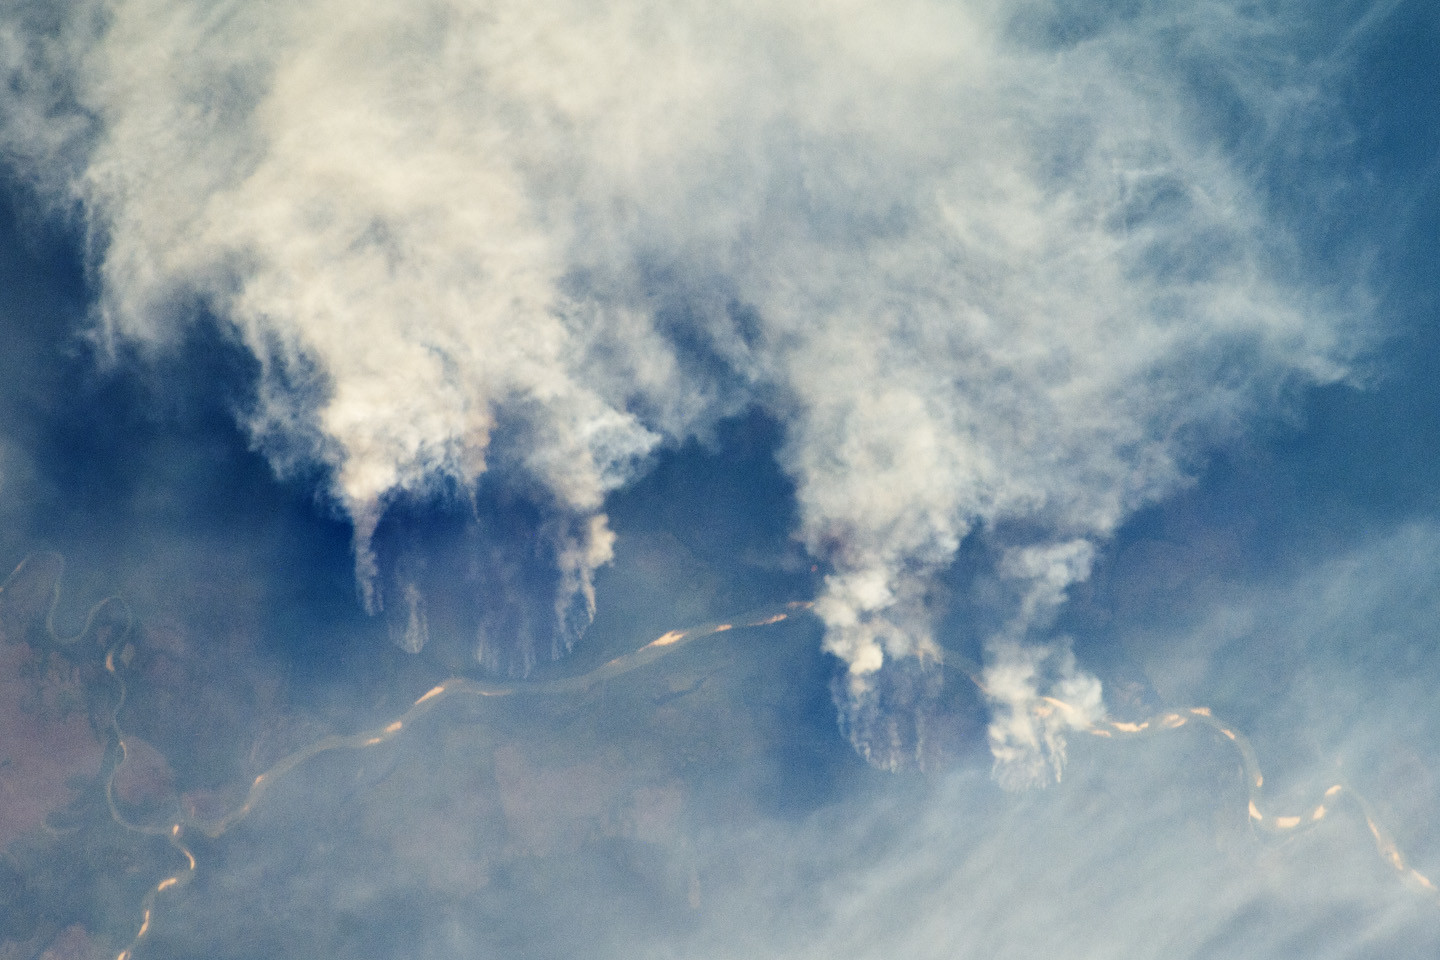
In Brazil, relaxed measures against forest clearing have already resulted in increased fires in recent years, and the pandemic has heightened concerns of unchecked destruction this year. Earlier this year Brazil’s National Institute for Space and Research (INPE) called for immediate fire prevention actions, citing “demand for hospitalizations due to respiratory problems induced by fires increases concomitantly with the COVID-19 pandemic, a worsening and possible collapse of public health is expected in several states, including those belonging to the Brazilian Amazon.” Fires are persisting, despite a 120-day ban on burning imposed last month.
Using the significant fires visualization, which shows how current fires compare statistically to the historical average, we can see which Brazilian states are currently experiencing higher than usual levels of fire— a sign of where air pollution from active fires has the greatest potential to exacerbate the impacts of the pandemic.
Are we in peak fire season?
When the COVID-19 pandemic struck the United States, the US Forest Service suspended controlled burns across several western states, and many routine fire prevention projects had to be cancelled or postponed as officials worried at the ability of firefighters to maintain social distance in training camps.
The US fire season spans the summer months, but GFW’s weekly fire alert calculation can give a more specific picture of how regional fire seasons typically shape up over the course of the year, helping keep a closer eye on how the fire season is playing out this year. The season usually peaks in August or September but the chart below shows current California fires are well above normal even for August.
How does this year compare historically?
In Indonesia, an intense 2019 fires season threatened to disrupt the country’s progress reducing deforestation, despite enhanced fire prevention. Claims of increased illegal logging while enforcement efforts are hampered by coronavirus restrictions means this year’s fires season could pose an even bigger threat. But how do these fire seasons compare across a longer time span?
GFW offers fire data back to the early 2000s to compare fire seasons year over year and make it easier to detect trends and outliers. The cumulative fire alert charts below show how past fire seasons have progressed for Indonesia in the last two decades.
Reporting stoked fears of another dramatic fire season in Brazil where, like the US, the season is most severe in August and September. The chart below confirms that fires have begun to pick up, and states like Mato Grosso are reaching alert counts similar to other historic fire years.
Are fires threatening forests?
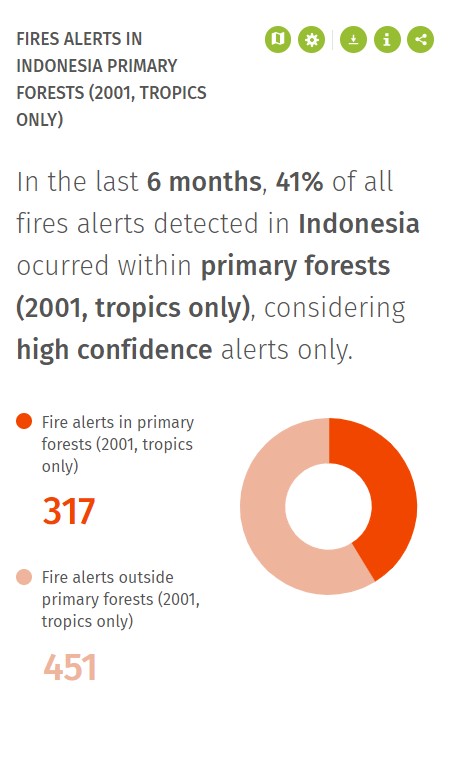
Fires data on GFW can also be overlaid with the other datasets available on GFW to determine whether fire alerts are being detected in ecologically sensitive areas like primary and mangrove forests, or on protected areas and Indigenous lands. In the last six months, for example, almost half of Indonesia’s active fires have occurred in primary forests.
We can also see the extent of fires occurring within tree plantations, where out of control fires often begin. Plantation companies could require even more scrutiny this season to avoid the impacts of haze on the public health system.
The pandemic shows no reliable signs of letting up in the next few months. As we hit the peak of many fire seasons around the world, governments and emergency response systems will have to remain vigilant and react quickly in order to safeguard the health of their people and forests.
